

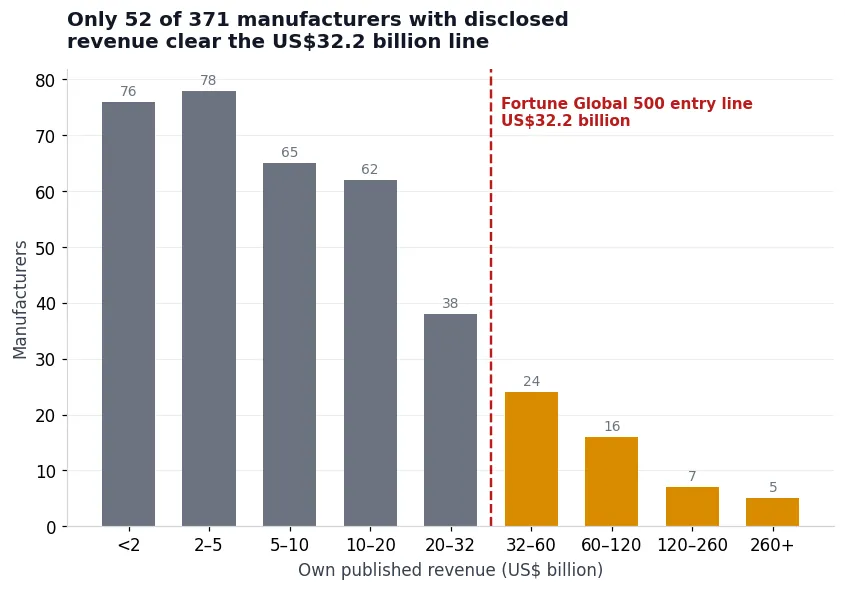
Of the 371 manufacturers in our database that disclose revenue, exactly 52 clear the Fortune Global 500 entry line of US$32.2 billion. That is 14%. The other 319 — 86% of companies with disclosed figures — do not, and the gap between those two groups explains why our industry scoring reserves its top band so narrowly.
Why US$32.2 Billion Is the Right Line
The 2025 Fortune Global 500 admitted companies at US$32.2 billion in revenue. Below that threshold, a company can be the undisputed leader of its industry and still be an order of magnitude smaller than the smallest entrant on the global list. Conflating the two — "industry leader" and "Fortune 500 company" — is the single most common error in industry reporting, and it is why we score on own published revenue rather than list membership.
Subsidiaries and divisions never inherit their parent’s revenue in our methodology. A wholly-owned division of a Fortune 500 parent is not itself a Fortune 500 company, and its score reflects its own disclosed figures.
The Manufacturers Above the Line
| # | Company | Headquarters | Revenue |
|---|---|---|---|
| 1 | Saudi Arabian Oil Company | Saudi Arabia | $490.0bn |
| 2 | PetroChina Company Limited | China | $400.0bn |
| 3 | China Petroleum and Chemical Corporation | China | $385.0bn |
| 4 | Exxon Mobil Corporation | United States | $323.9bn |
| 5 | Shell plc | United Kingdom | $266.9bn |
| 6 | Glencore | Switzerland | $247.0bn |
| 7 | BP p.l.c. | United Kingdom | $210.0bn |
| 8 | Chevron Corporation | United States | $184.4bn |
| 9 | TotalEnergies SE | France | $182.3bn |
| 10 | China National Building Material Group Co., Ltd. (CNBM) | China | $177.8bn |
| 11 | Reliance Industries Limited | India | $128.0bn |
| 12 | Valero Energy Corporation | United States | $122.7bn |
| 13 | SAIC Motor | China | $105.2bn |
| 14 | Abu Dhabi National Oil Company | United Arab Emirates | $100.0bn |
| 15 | Johnson & Johnson (J&J) | United States | $94.2bn |
The composition is dominated by energy and materials — Saudi Aramco, PetroChina, Sinopec, ExxonMobil, Shell, Glencore, BP. This is not a sampling artefact. Revenue at this scale is almost always a function of moving physical volume, and the industries that move the most volume are oil, gas, mining, and bulk materials.
Where the Above-Line Companies Sit
| Headquarters | Companies above the line |
|---|---|
| United States | 15 |
| China | 10 |
| United Kingdom | 5 |
| Switzerland | 4 |
| France | 3 |
| Japan | 3 |
| Ireland | 2 |
| Saudi Arabia | 1 |
The United States supplies 15 of the 52, China 10. Combined with the United Kingdom, Switzerland, and France, five countries account for 37 of the total.
Country of headquarters is also not the same as country of operation. Several of the companies above the line operate more manufacturing capacity outside their home market than inside it — a distinction our verified enterprise directory records per company.
How to Use This Threshold
For procurement teams, the line is a useful filter for financial durability but a poor one for supplier fit. A US$40 billion materials company is not a better source of precision components than a US$400 million specialist — it is simply less likely to disappear. Use the revenue line to assess counterparty risk, and our industry rankings to assess capability.
Every ranking on VerityRank shows each company’s own published revenue alongside its position, so you can apply the US$32.2 billion test yourself. Start from the all-industries manufacturer index.
The Companies Just Below the Line
The more instructive group sits immediately under US$32.2 billion. Companies in the US$15–32 billion band are large enough to have global reach, formal compliance functions, and multi-country manufacturing, but small enough that a single strategic mistake is existential. They also tend to be the most attractive suppliers for buyers who want attention: a company at US$20 billion will staff an account that a US$400 billion company will route to a portal.
Our database contains several hundred manufacturers in that band, and they are heavily over-represented in the industries where buyer-supplier relationships are engineering-led rather than transactional. The power transmission ranking and fluid handling ranking are the clearest examples: both are dominated by companies well below the Fortune 500 line that nonetheless control a disproportionate share of global supply.
How We Handle Disclosed Revenue
Revenue figures in our database are taken from company disclosures, annual reports, and audited statements where available, and are recorded in the currency the company reports in. Where a company discloses in a non-US currency we convert at a fixed published rate and label the conversion, so the figure can be independently checked. Where a company discloses revenue in a range, we record the range rather than a midpoint.
We exclude brand entries that carry a parent group’s consolidated revenue. This is a significant distinction: a brand owned by a large group is a product line, not a company, and attributing group revenue to it would overstate its standalone position by an order of magnitude. Only 371 of the manufacturers we cover disclose revenue in a form that supports this test at all — most private companies in our directory publish no figure, and we do not estimate.
That gap between 1506 verified companies and 371 with usable revenue data is itself a finding. Private manufacturers dominate global supply chains far more than the Fortune 500 framing suggests, and the majority of them will never appear on any revenue-based league table.
Questions Buyers Actually Ask
What is the Fortune Global 500 revenue entry line for 2025?
US$32.2 billion. Companies below that figure are not eligible for the Global 500 list regardless of industry position. VerityRank uses the same line to define the top band of its own industry scoring, rather than using list membership itself.
Do subsidiaries of Fortune 500 companies count as Fortune 500 companies?
No. Under our methodology a subsidiary or division never inherits its parent’s revenue. A wholly-owned division of a listed parent is scored on its own disclosed figures and is treated as a separate supplier from the parent company.
Why are most companies above the US$32.2 billion line in energy and materials?
Because revenue at that scale generally requires moving very large physical volumes. Oil, gas, mining, and bulk materials companies dominate the above-line group in our database — 52 of 371 manufacturers with disclosed revenue clear it, and the largest are Saudi Aramco, PetroChina, Sinopec, and ExxonMobil.