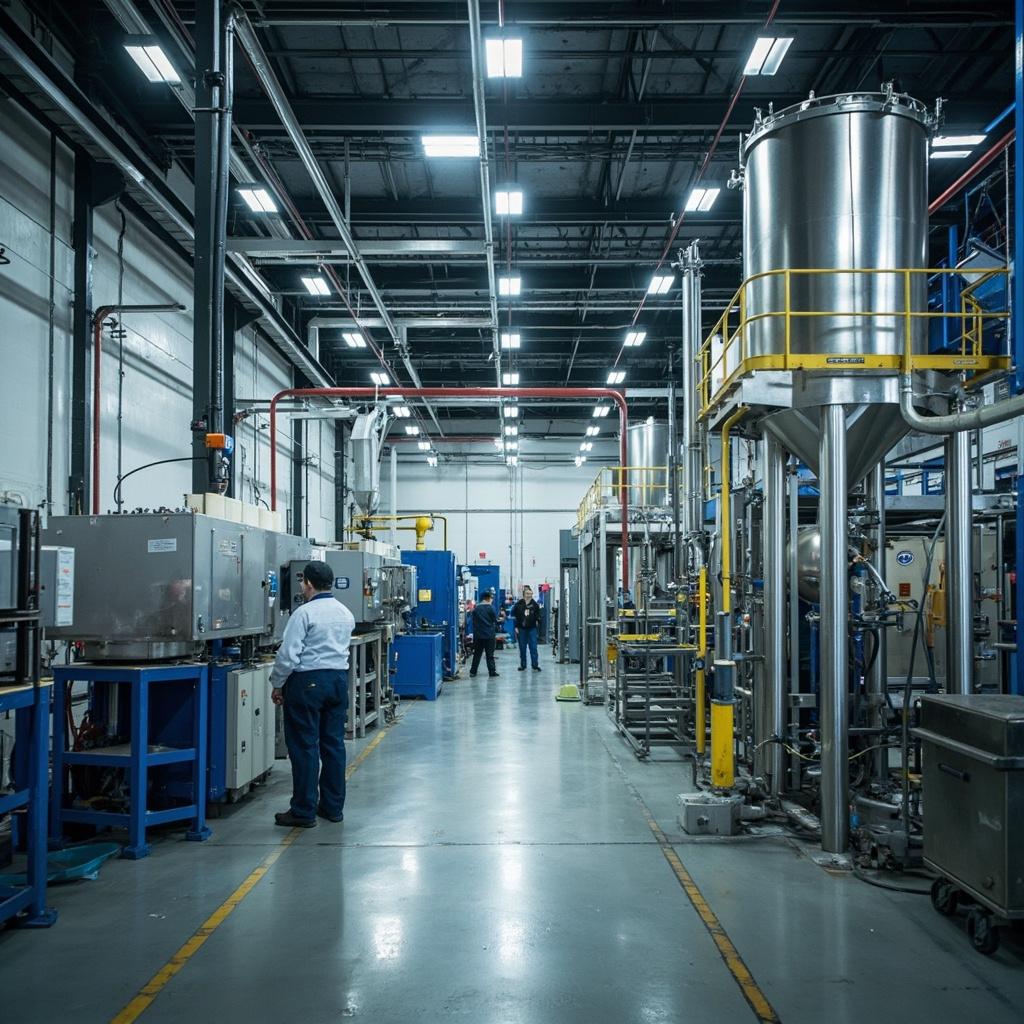
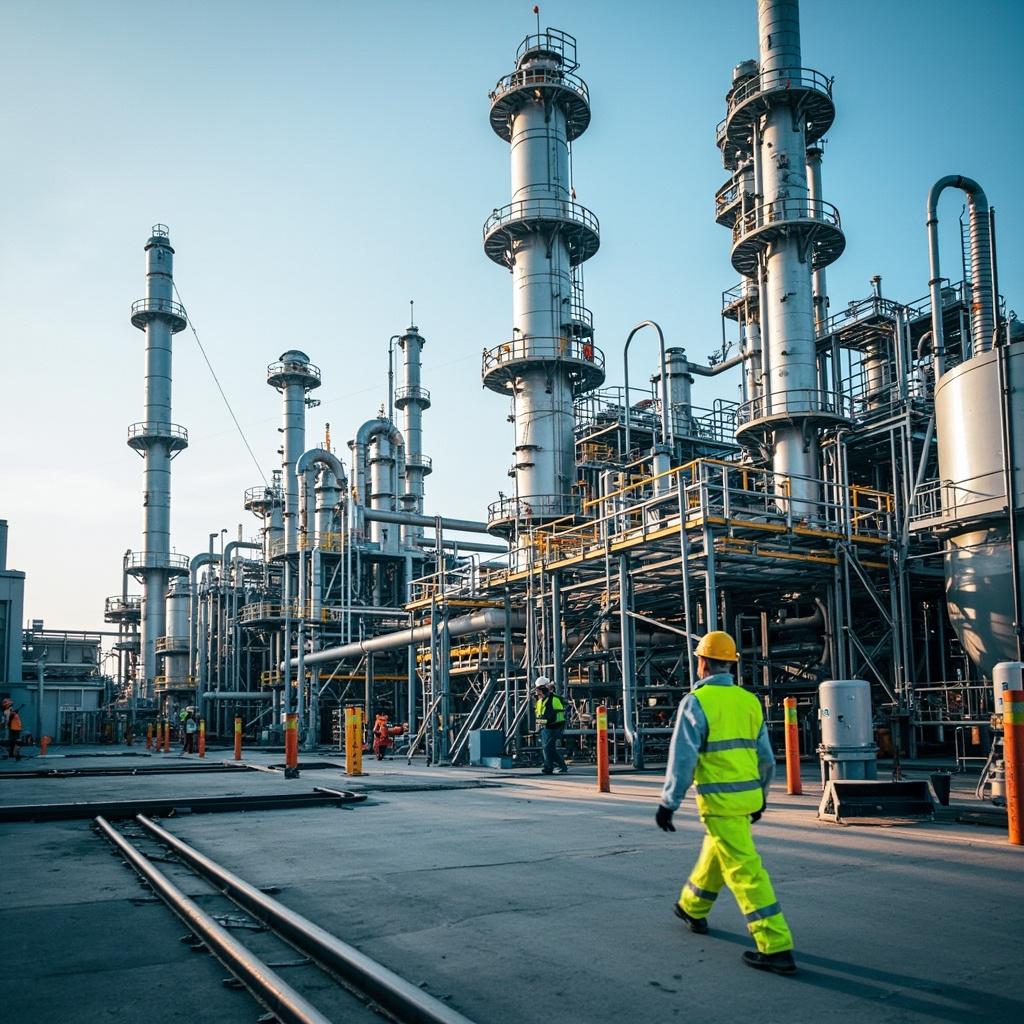
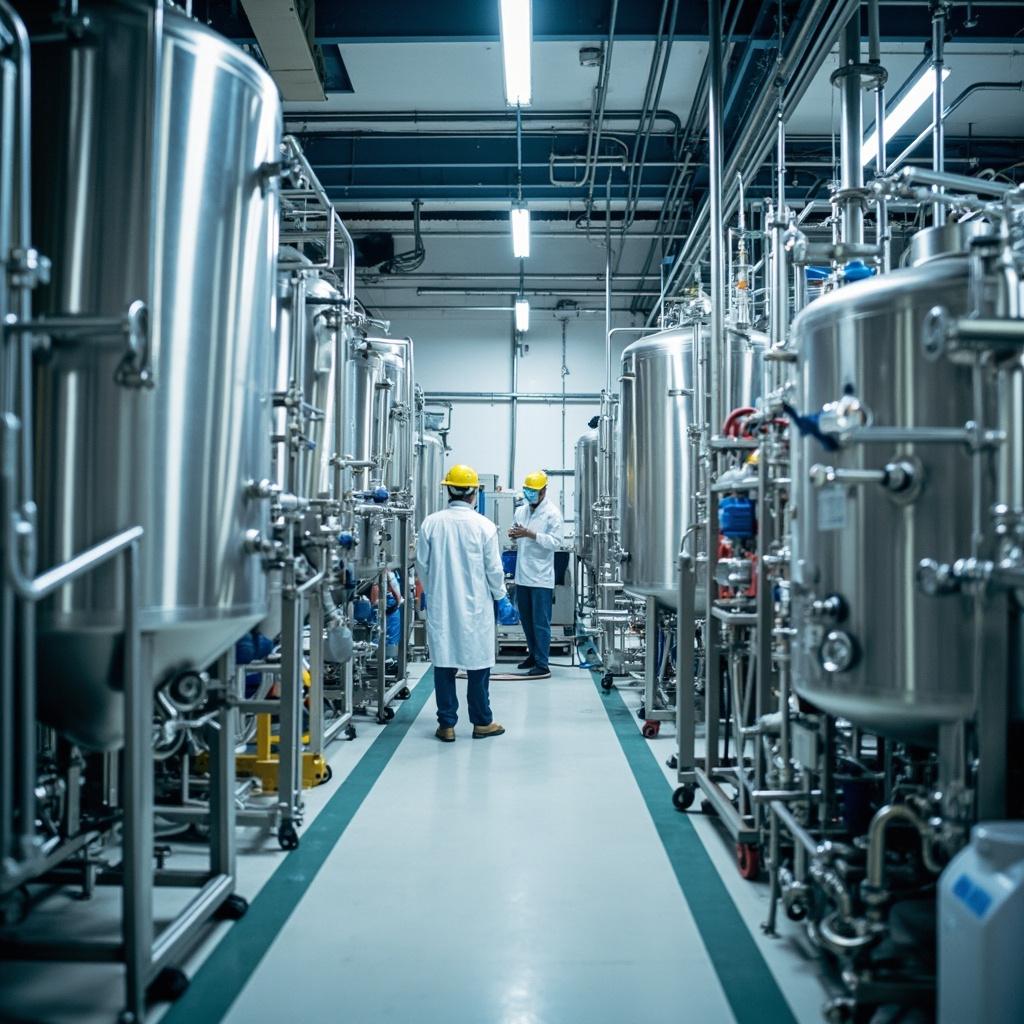
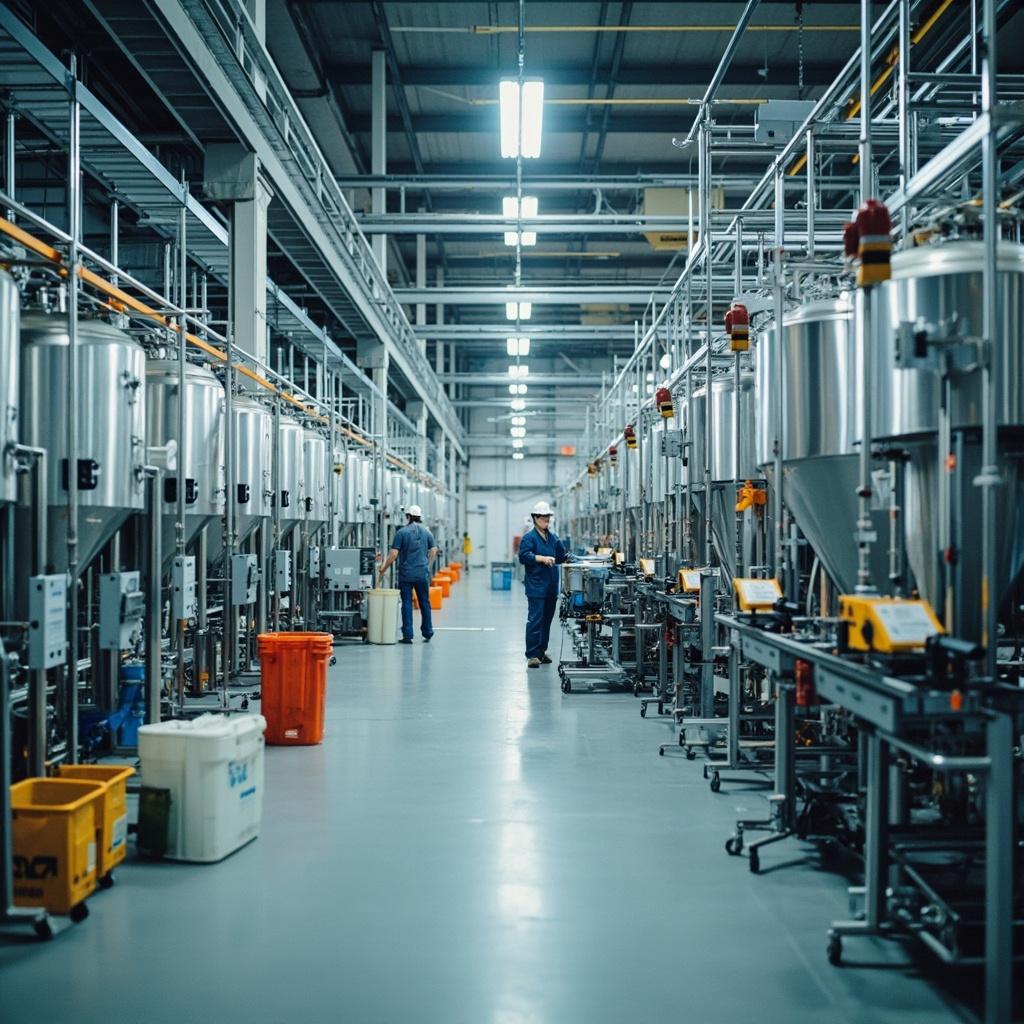
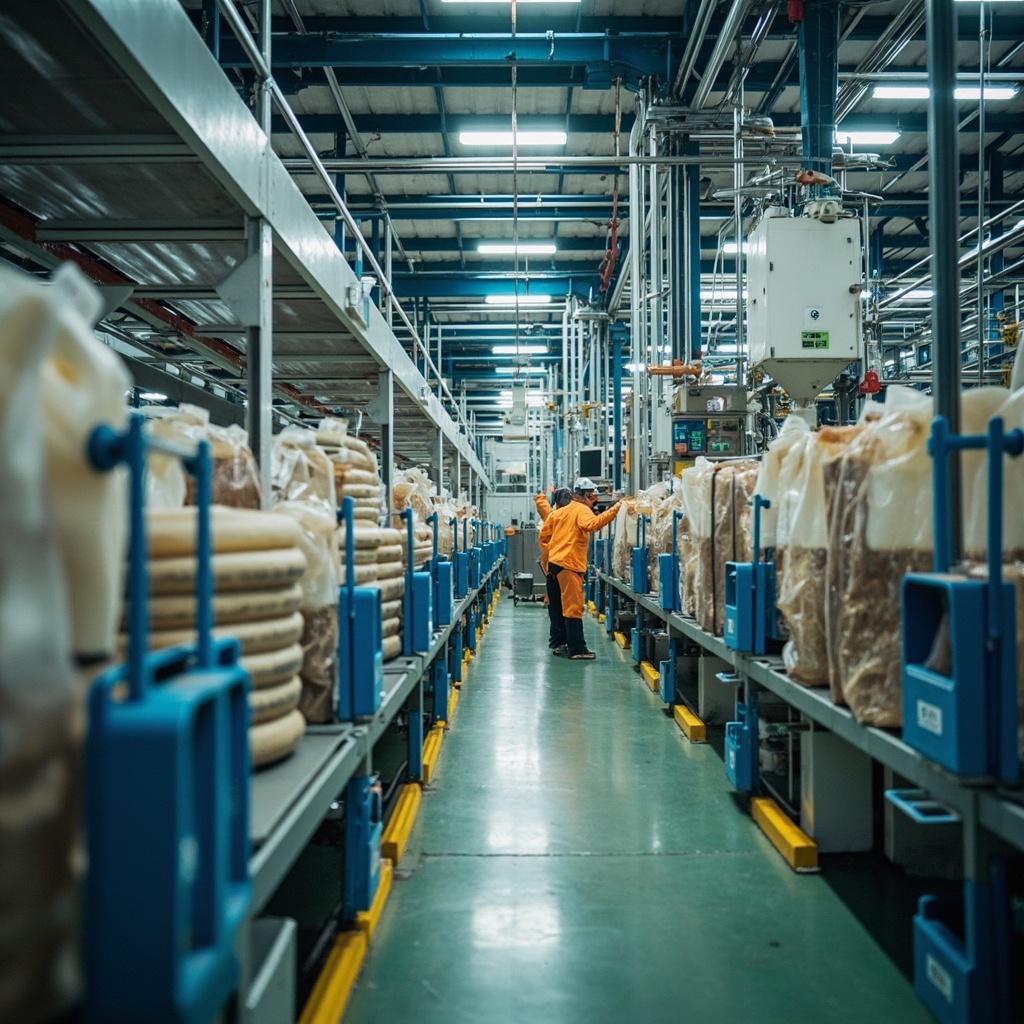
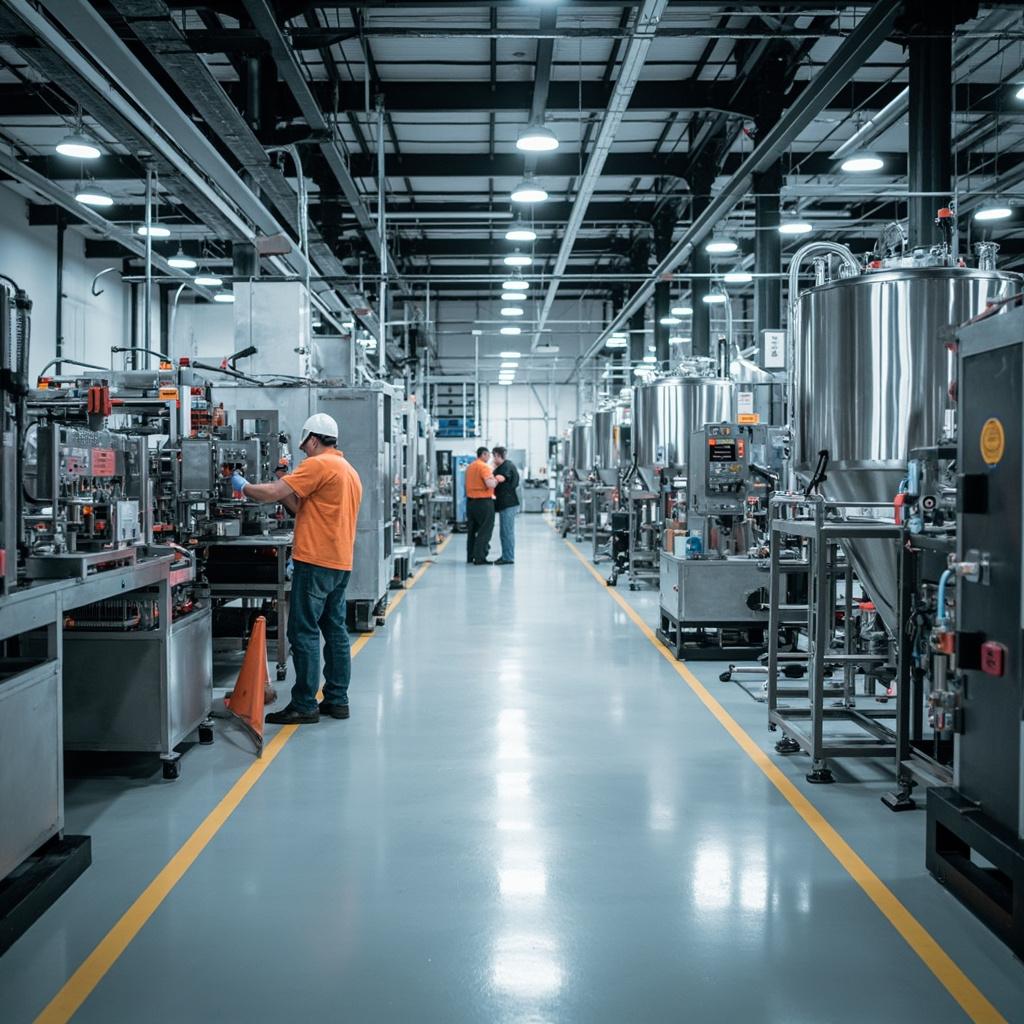
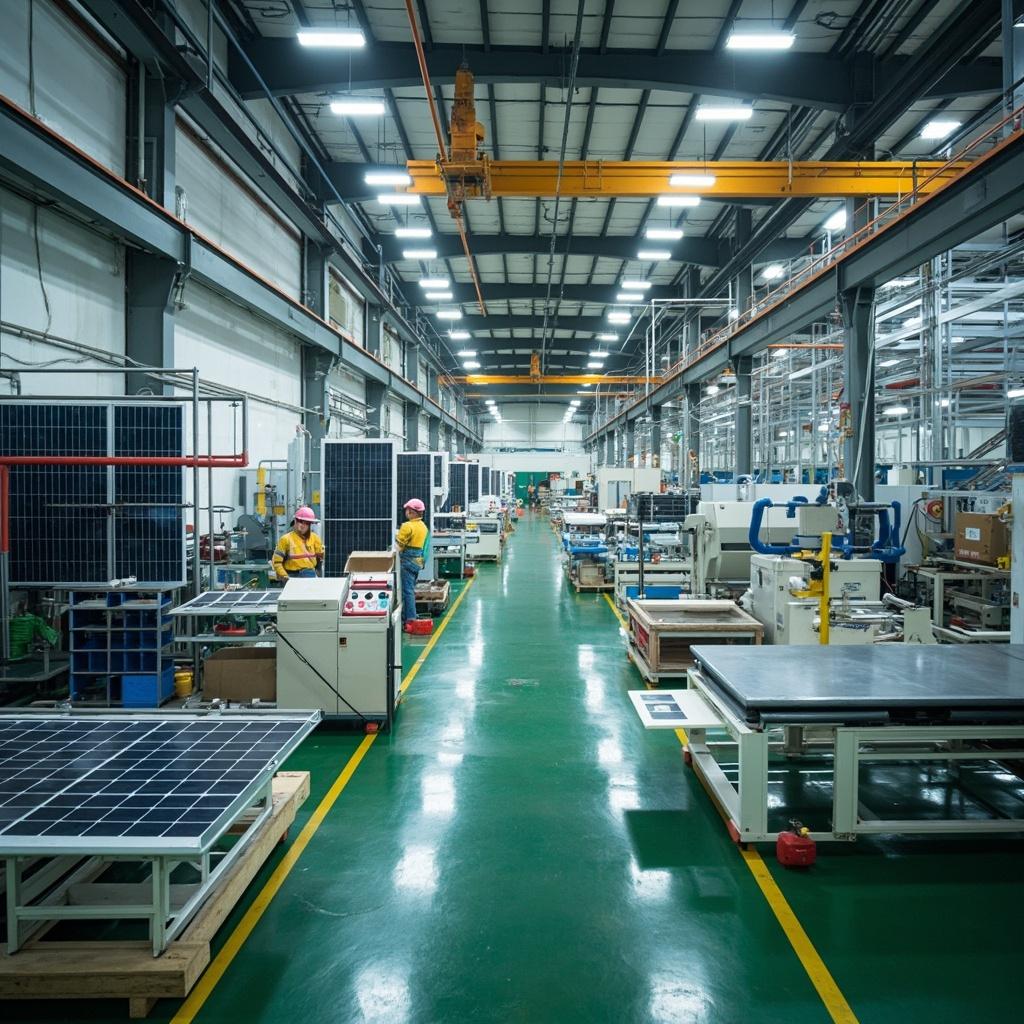
Our manufacturer ranking is built on a rigorous four-dimensional scoring framework that evaluates genuine production capabilities rather than brand marketing presence or consumer sentiment. The framework assigns equal weight (25% each) to four critical dimensions. Production Scale measures annual output tonnage, number of owned manufacturing facilities, total facility footprint, and recent capital investment in capacity expansion—companies relying on third-party tolling are excluded from consideration. Technological Integration evaluates the depth of vertical manufacturing capability, from basic chemical feedstock synthesis through to finished formulation, awarding highest scores to companies that maintain full backward integration and operate proprietary synthesis technology with significant in-house R&D intensity.
Supply Chain Reach assesses the geographic breadth of each manufacturer's owned production and distribution network, including the number of countries with direct manufacturing operations, total active product registrations, and supply chain resilience demonstrated during recent global disruptions. Sustainability & Compliance captures environmental stewardship through greenhouse gas emission reduction trajectories, renewable energy adoption rates in manufacturing, water stewardship programs, adherence to international Good Manufacturing Practice (GMP) standards, and compliance records with the most stringent regulatory frameworks including EU REACH and US EPA requirements. Our data is sourced exclusively from official company filings, audited annual reports, and verified third-party market research, ensuring complete objectivity in our assessment.
Importantly, this manufacturer ranking differs fundamentally from brand rankings in that it evaluates companies based on what they physically produce and own, not what they market. Entities that primarily operate as brand licensors, traders, or pure contract manufacturers without substantial owned production assets are excluded regardless of revenue size. Each company's score reflects a weighted composite of the four dimensions above, with final scores verified against multiple independent data sources including Fitch Ratings, S&P Global, and industry analyst reports from MarketsandMarkets and Spherical Insights.
The ranking is updated semi-annually to reflect the latest financial disclosures, capacity expansions, and strategic developments. Company scores may shift between updates as new factory commissioning, major acquisitions, regulatory actions, or significant sustainability milestones are incorporated into our models. Readers are encouraged to consult the individual manufacturer profiles linked from the ranking page for detailed breakdowns of each company's performance across all four evaluation dimensions.
Our methodology is designed to provide a transparent, data-driven assessment that serves as a practical reference for procurement professionals, agricultural distributors, and industry analysts seeking to understand the true manufacturing capabilities behind the world's leading agrochemical brands.
The defining characteristic of a truly excellent agrochemical manufacturer is the depth and completeness of its vertical integration—the ability to synthesize active ingredients from basic chemical feedstocks rather than purchasing intermediates from third-party suppliers. At the highest tier, exemplified by manufacturers like Syngenta, Bayer, and BASF, production begins with basic petrochemical or mineral inputs that are progressively transformed through multi-step chemical syntheses carried out entirely within owned facilities. This backward integration confers three critical advantages: absolute quality control over every synthesis step, protection of proprietary process technology and intellectual property, and insulation from supply chain disruptions that can paralyze formulators dependent on external active ingredient sources.
The second hallmark of manufacturing excellence is scale and redundancy. Top-tier manufacturers operate multiple production sites on multiple continents, often with the capability to produce the same active ingredients at different facilities, ensuring uninterrupted supply even if one plant experiences downtime. Nutrien exemplifies this at the extreme end of the spectrum, producing 27.5 million tonnes annually from mines and processing facilities spread across North America with over 5,600 owned rail cars ensuring continuous logistics. Scale also determines cost competitiveness: manufacturers operating at world-scale capacity typically achieve unit production costs 30-50% below smaller competitors, a margin advantage that funds sustained R&D investment.
A third differentiator is the breadth and sophistication of the product portfolio, particularly in biological and biorational products. While traditional chemical synthesis remains the industry backbone, leading manufacturers have invested heavily in microbial fermentation capacity, plant extract processing, and RNAi technology platforms. Sumitomo Chemical's Valent BioSciences subsidiary operates the world's largest dedicated biorational manufacturing infrastructure, while Corteva maintains over 120 R&D facilities globally that bridge chemical and biological discovery. The ability to produce both chemical and biological solutions under one manufacturing roof is rapidly becoming the defining competitive advantage of the next decade.
Finally, excellent manufacturers distinguish themselves through their regulatory intelligence infrastructure. Each country maintains its own pesticide registration requirements, residue limits, and environmental safety standards—often requiring years of local field trials and toxicology studies before a product can be sold. Rainbow Chemical's portfolio of over 5,000 product registrations across 100+ countries, built through dedicated in-country teams, represents a formidable barrier that no contract formulator can easily replicate. This combination of deep vertical synthesis, massive production scale, dual chemical-biological capability, and comprehensive regulatory mastery defines the manufacturers that truly lead the global agrochemical industry.
In summary, the gap between a genuine manufacturer and a formulator is measured not in marketing spend but in the physical assets—reactors, fermenters, and registration dossiers—that determine who actually controls the world's agricultural input supply.
Leading agrochemical manufacturers operate multi-layered quality control architectures that span the entire production chain—from incoming raw material verification through in-process monitoring to finished product release testing—with each layer governed by internationally certified management systems. At the foundation, virtually all top-10 manufacturers maintain ISO 9001:2015 certification across their manufacturing facilities, establishing the framework for documented quality management from supplier qualification through customer complaint handling. However, ISO 9001 represents only the baseline; the most advanced manufacturers layer additional standards including ISO 14001 (environmental management), ISO 45001 (occupational health and safety), and increasingly ISO 50001 (energy management) across their global production networks.
Active ingredient synthesis receives the most rigorous quality scrutiny in the entire production chain. During chemical synthesis of pesticide active ingredients, manufacturers employ real-time process analytical technology (PAT) including in-line spectroscopy, automated titration systems, and continuous gas chromatography monitoring to verify that reaction conditions remain within validated parameters throughout each batch. Any deviation from specification triggers immediate corrective action before the batch proceeds further. Impurity profiling is particularly critical: using high-performance liquid chromatography (HPLC), gas chromatography-mass spectrometry (GC-MS), and liquid chromatography-mass spectrometry (LC-MS), quality laboratories identify and quantify every impurity above 0.1% concentration, ensuring that no toxicologically significant byproducts reach the final product.
Finished product testing extends beyond chemical purity to encompass physical performance characteristics essential for field efficacy. Formulation stability under accelerated aging conditions (typically 54°C for 14 days, equivalent to two years of ambient storage) is verified for every production campaign. Suspension concentrates must demonstrate less than 2% phase separation after centrifugation testing. Wettable powder formulations undergo standardized wet-sieve retention tests to ensure particle size distribution matches the registered specification. Emulsifiable concentrates are tested for emulsion stability in water of varying hardness (20-1,000 ppm CaCO₃ equivalent) to guarantee performance regardless of the farmer's local water quality.
Beyond in-house quality systems, the industry is increasingly adopting third-party certification programs that provide independent verification of manufacturing standards. The FAO/WHO Joint Meeting on Pesticide Specifications (JMPS) establishes internationally recognized equivalence standards that manufacturers must meet to supply products for government procurement and donor-funded agricultural programs. CropLife International's obsolete stock management protocols require certified destruction capabilities for expired or banned products. In Europe, compliance with the Biocidal Products Regulation (BPR) and Plant Protection Products Regulation (PPPR) demands full traceability from raw material lot numbers through to finished product batch codes—a documentation burden that manufacturers like BASF and Bayer meet through fully digitized manufacturing execution systems (MES) integrated with their enterprise resource planning platforms. These overlapping layers of internal quality control and external certification ensure that products reaching farmers consistently meet efficacy, safety, and environmental standards irrespective of which facility produced them.
The quality control investment of a top-tier manufacturer typically represents 3-5% of total manufacturing cost—a substantial sum that pure contract formulators often cannot sustain, creating yet another barrier that protects the competitive position of vertically integrated producers.
The agrochemical manufacturing landscape is being reshaped by three converging forces in 2026: the biological revolution in crop protection synthesis, the decarbonization imperative transforming chemical plant operations, and the strategic restructuring of the industry's largest players through spin-offs and consolidation. The biological products segment, encompassing microbial biopesticides, biochemical plant growth regulators, and RNAi-based crop protection, is growing at 12-15% annually—roughly three times the rate of conventional chemical pesticides—and is fundamentally altering what "manufacturing" means in this industry. Unlike traditional chemical synthesis that relies on petrochemical feedstocks and high-temperature reactors, biological manufacturing requires sterile fermentation suites, downstream purification systems for living organisms, and cold-chain distribution infrastructure that few traditional chemical plants possess.
This biological transition is driving unprecedented capital investment in new manufacturing modalities. BASF's commissioning of a dedicated biological fermentation facility at its Ludwigshafen Verbund site represents a template for how traditional chemical giants are building biological capability adjacent to existing chemical infrastructure, sharing utilities and waste treatment systems to reduce costs. Syngenta's Biologicals division now operates dedicated fermentation facilities on multiple continents, leveraging the company's agricultural distribution network to place biological products alongside conventional chemicals. The total addressable market for biological crop protection is projected to exceed US$25 billion by 2030, and the manufacturers who build fermentation capacity today will define the competitive landscape of the next decade.
Simultaneously, the decarbonization of chemical manufacturing is accelerating, driven by both regulatory pressure and economic rationale. Yara International, the world's largest nitrogen fertilizer producer, has committed to reducing its greenhouse gas emission intensity by 30% by 2030 through a combination of green ammonia production using renewable hydrogen, carbon capture and storage at its existing plants, and electrification of steam reforming processes. Nutrien has driven its potash manufacturing cash cost below US$60 per tonne through automation and energy efficiency improvements—demonstrating that sustainability investments can deliver both environmental and economic returns. The EU Carbon Border Adjustment Mechanism (CBAM), which began its transitional phase in 2023 and will impose full carbon costs on imported chemicals by 2026-2027, is creating a powerful economic incentive for manufacturers worldwide to decarbonize or face tariff penalties in the world's largest agricultural chemical market.
The third transformative trend is the industry's structural reorganization through major spin-offs and strategic reviews. Corteva's planned separation into two independent publicly traded companies—one focused on crop protection chemicals and natural-derived technologies, the other on seeds—represents the most significant corporate restructuring in the industry since the Dow-DuPont merger that created Corteva in 2019. BASF's announced intention to pursue an IPO of its Agricultural Solutions division by 2027 could create the world's largest publicly traded pure-play agricultural chemical manufacturer. Meanwhile, FMC Corporation's ongoing strategic alternatives review, which explicitly includes a potential sale of the entire company, signals that even century-old manufacturers are not immune to the forces of industry consolidation. These restructurings, while disruptive in the short term, are expected to create more focused, efficient manufacturing entities that can better allocate capital to the biological and digital technologies that will define the industry's future.
For farmers and downstream buyers, these trends collectively point toward a future where crop protection products are increasingly produced with lower carbon footprints, delivered through integrated biological-chemical programs, and sourced from manufacturers whose corporate structures enable faster innovation cycles.
This manufacturer ranking undergoes a comprehensive semi-annual review, with formal updates published in May and November each year to coincide with the completion of annual and half-year financial reporting cycles across the global agrochemical industry. The semi-annual cadence is deliberately chosen because it allows our analysts to incorporate the most significant data releases—full-year audited financial statements (typically published between February and April), Q1 and Q3 interim reports, and annual production volume disclosures—while maintaining sufficient frequency to capture meaningful shifts in the competitive landscape. Between formal updates, our monitoring team continuously tracks material developments that could trigger an off-cycle re-evaluation if their cumulative impact would materially alter any manufacturer's position.
Several categories of events can trigger an interim re-evaluation outside the regular cycle. Major mergers and acquisitions—such as Rainbow Chemical's €32 million acquisition of Spanish manufacturer Sarabia S.A. in 2025—directly affect both production capacity scores and supply chain reach metrics, and are incorporated within 30 days of deal closure. New manufacturing facility commissioning represents another trigger: when a manufacturer brings a major new synthesis plant or fermentation facility online, the incremental capacity can meaningfully shift its Production Scale score, particularly if the facility adds capabilities in high-growth segments like biological products where manufacturing capacity is scarce. Similarly, the closure or divestiture of significant manufacturing assets—as occurred when Sumitomo Chemical divested its home gardening consumer business in 2025—triggers a reassessment of the manufacturer's remaining production portfolio.
Regulatory actions constitute the third major trigger category. When a manufacturer receives a significant regulatory approval—such as EU approval for a new active ingredient, which can take 3-5 years and cost over US$200 million—this substantially strengthens its Technological Integration score by validating its R&D and regulatory capabilities. Conversely, the revocation or non-renewal of critical product registrations, or the imposition of significant manufacturing-related fines by environmental or safety regulators, can negatively impact both the Technological Integration and Sustainability dimensions. Our analysts monitor regulatory dockets across the EU (ECHA), US (EPA), Brazil (ANVISA/IBAMA), and China (ICAMA) to ensure timely incorporation of regulatory developments into manufacturer assessments.
Finally, significant financial deterioration or improvement can prompt re-evaluation. FMC Corporation's 2025 financial results, which included an 18% revenue decline and negative US$165 million in free cash flow, triggered an immediate review of its Supply Chain Reach and Production Scale sustainability. Conversely, Rainbow Chemical's 132% net profit surge in 2025 prompted an upward revision of its position. The VerityRank Score for each manufacturer is recalculated whenever any of the four underlying dimension scores change by 5 points or more, ensuring that the ranking always reflects the most current data. Readers can identify the most recently evaluated manufacturers by the "Last Updated" date displayed on each company's profile page within the ranking.
We welcome reader feedback and data submissions that may enhance the accuracy of our assessments. Manufacturers, industry analysts, and agricultural professionals who possess verified production data not reflected in our current analysis are encouraged to contact our research team through the channels listed on our contact page.