

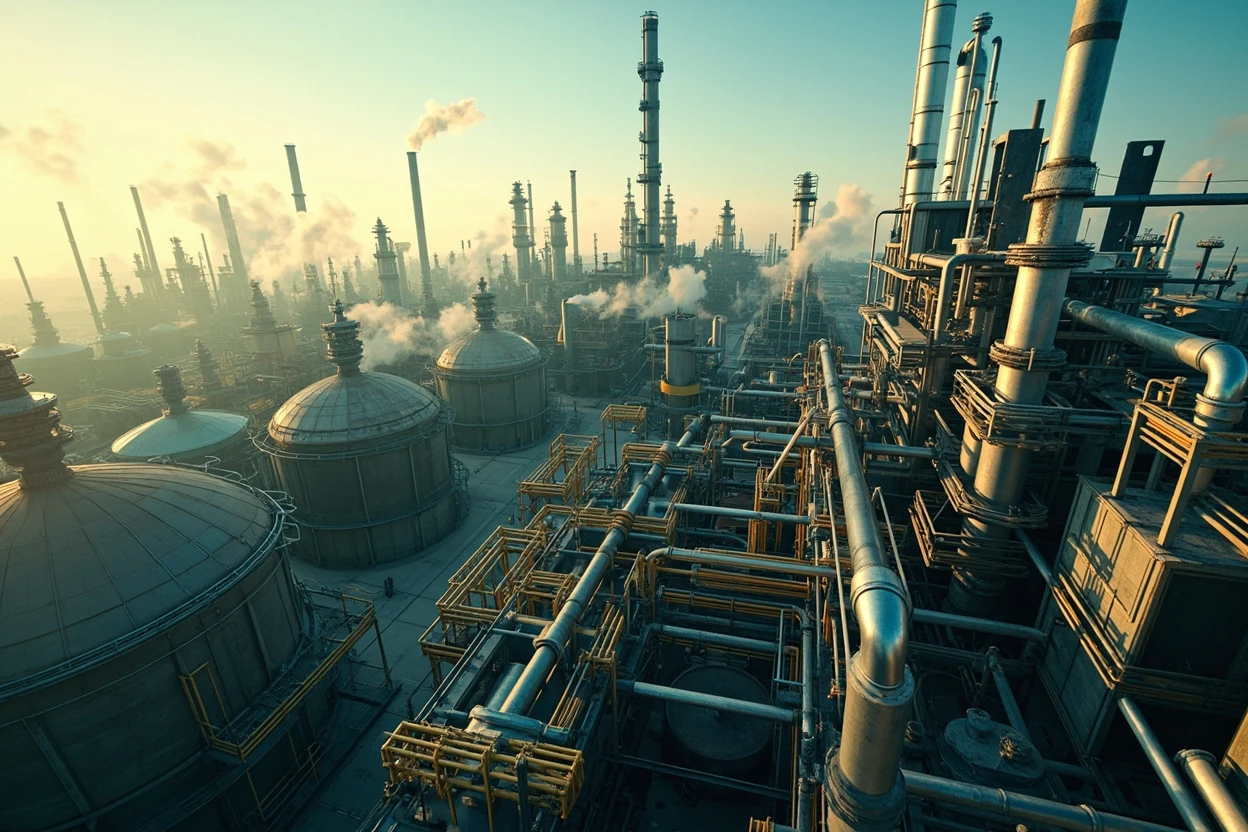
Table of Contents

The global Energy & Chemical Materials sector serves consumers worldwide with diverse solutions.
1. Industry Overview
By 2026, the global chemicals and materials market is expected to surpass $1.02 trillion – yet many of the world’s largest producers are fighting stagnant demand and chronic overcapacity. The industry, which supplies the essential building blocks for everything from smartphone screens to jet fuels, is at a historic inflection point. Capital spending is projected to rise just 0.9% in 2026, reflecting deep caution among executives who once raced to expand capacity.
Industry Scope & Characteristics
Broad Product Portfolio
Products span fuels, lubricants, coatings, adhesives, plastics, agrochemicals, cosmetic ingredients, electronic chemicals, new energy materials, serving diverse consumer needs from everyday essentials to premium specialized offerings.
Complex Global Supply Chains
Integrated international networks spanning multiple continents ensure year-round product availability across diverse markets.
Quality & Compliance Standards
Rigorous regulatory frameworks and quality certifications ensure product safety, consistency, and consumer trust worldwide.
Continuous Innovation
Heavy R&D investment drives formulation breakthroughs, processing technologies, and novel product development cycles.
This sector encompasses fuels, lubricants, coatings, adhesives, plastics, agrochemicals, cosmetic ingredients, electronic chemicals, and new energy materials. Its role in the broader economy is foundational: no manufacturing supply chain exists without chemical inputs. But the post-pandemic boom has given way to a glut. Polyethylene and polypropylene prices have slumped, while Chinese producers add millions of tons of new capacity.
In response, engineers and strategists are pivoting toward safer-and-sustainable-by-design (SSbD) chemicals, carbon removal technologies, circularity, and intelligent R&D. The race is no longer about who can produce the most tons, but who can command premiums for high-margin, high-growth products like battery-grade electrolytes, bio-based monomers, and low-carbon ammonia.
For buyers, the shift means new supply risks and opportunities. Prices are moving faster than contract cycles, and verifying a supplier's environmental claims or financial stability has become as critical as checking product specs. VerityRank exists to cut through that complexity – delivering verified supplier data for the energy and chemical materials supply chain.
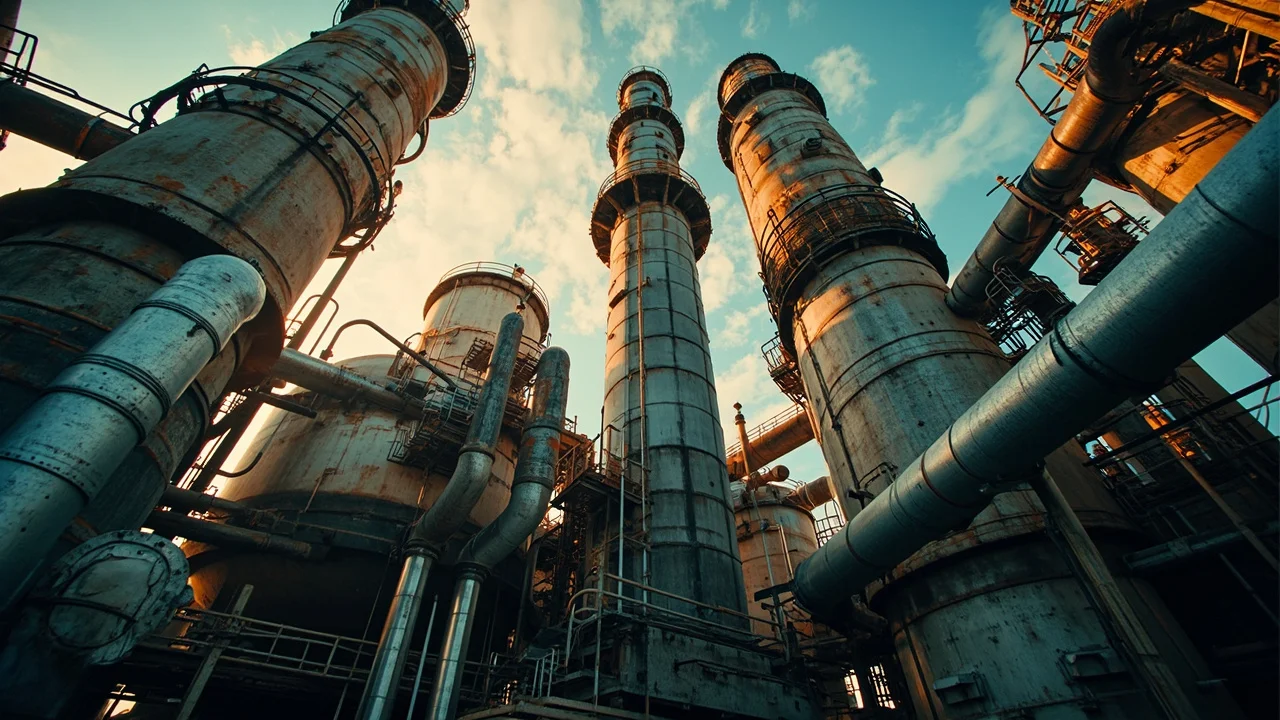
Key market segments and growth drivers in the Energy & Chemical Materials sector.

Key market segments and growth drivers in the Energy & Chemical Materials sector.
2. Market Analysis
The Global Chemicals And Materials Market is valued at $1.02 trillion in 2026, with projections calling for growth to $1.675 trillion by the early 2030s – a compound annual rate of roughly 8.5%. But headline growth masks a stark divergence: commodity chemicals are under severe margin pressure, while specialty and new energy materials expand at double-digit rates.
Three forces are driving the market. First, the energy transition: EV battery materials alone represent a $45 billion sub-segment in 2026, fueled by automakers’ aggressive electrification targets. Second, bio-based chemicals are growing at nearly 12% annually, as consumer brands demand renewable alternatives for packaging and textiles. Third, carbon capture and utilization (CCU) is creating entirely new product categories, from CO₂-derived polyols to synthetic e-fuels.
Geographically, Asia Pacific dominates with over 60% of global chemical output. China, led by Sinopec and other state-owned giants, added 8 million metric tons of new ethylene capacity in 2025 alone. Europe, by contrast, is ceding volume in base chemicals but leading in high-value specialties – particularly green hydrogen and circular polymers. North America benefits from cheap shale gas feedstock, with Dow and ExxonMobil Chemical focusing on advantaged ethane-based derivatives and carbon capture projects.
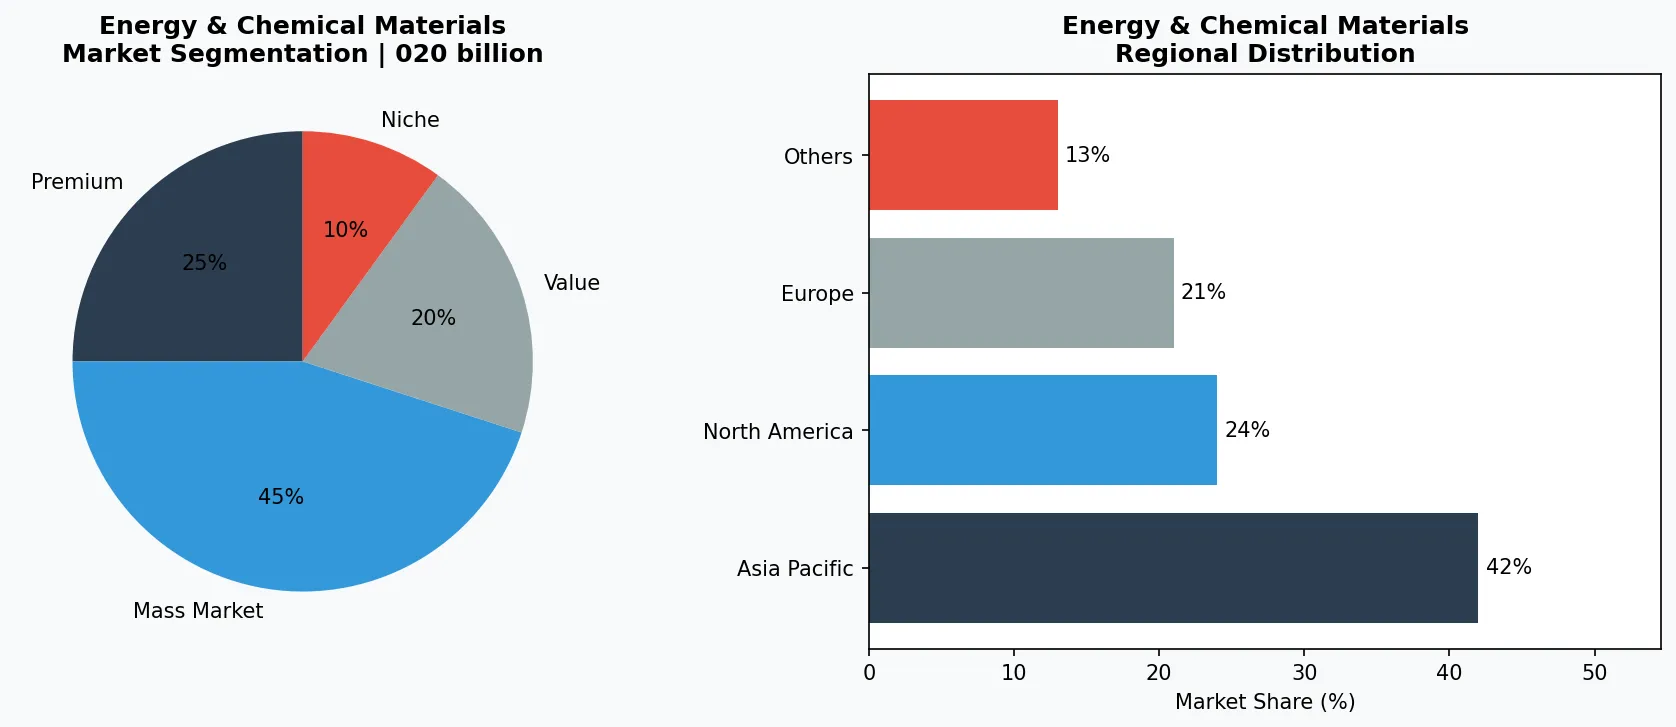
Market segmentation and regional distribution analysis for Energy & Chemical Materials.
3. Product Categories
Fuels and Lubricants
ExxonMobil Chemical produces high-performance synthetic basestocks for automotive and industrial lubricants. The shift toward electric vehicles is reducing demand for engine oils, but the market for heat-transfer fluids and transformer oils is expanding with data center and grid investments.
Plastics and Polymers
BASF’s portfolio includes engineering plastics like Ultramid (polyamide) used in automotive lightweighting, and biodegradable grades under the ecovio brand. SABIC supplies polycarbonate and polypropylene for medical devices and packaging. Oversupply in polyethylene is forcing these players to differentiate through circular products – SABIC’s certified circular polymers from mixed plastic waste are a prime example.
Agrochemicals, Coatings, and Electronic Chemicals
Dow provides crop protection chemicals and silicone-based coatings for solar panels. DuPont’s electronic materials business supplies photoresists and CMP slurries for semiconductor fabrication, a market growing 15% annually as chip fabs expand globally. LyondellBasell’s acetyls and polyolefins serve adhesives and sealants for construction and packaging.
Premium & Artisanal Tier
High-margin specialty products targeting affluent consumers who prioritize quality, craftsmanship, and unique attributes.
Mass Market Mainstream
Volume-driven products serving price-conscious mainstream consumers with reliable quality at accessible price points.
Functional & Niche Segment
Targeted products addressing specific health concerns, dietary requirements, or lifestyle preferences beyond basic needs.
4. Leading Players
BASF
The German giant is restructuring aggressively, divesting its oil and gas business (Wintershall Dea) and cutting 2,600 positions in its Ludwigshafen flagship site. Profitability over volume is the mantra: BASF is prioritizing high-margin battery materials (e.g., cathode precursors) and bio-based chemicals (e.g., biomass-balanced acrylic acid). It plans to invest €8 billion in carbon-neutral production by 2030.
Dow
Dow is doubling down on circularity and carbon capture. Its ‘Transform the Waste’ initiative aims to commercialize 3 million tons of circular and renewable materials annually by 2030. In 2025, Dow announced a partnership with LanzaTech to convert captured carbon into ethanol for ethylene production. The company also benefits from low-cost US Gulf Coast ethane crackers.
Sinopec
China’s state-controlled petrochemical leader is shifting from fuels to new energy materials. It has ramped up production of lithium-ion battery separators and hydrogen fuel cells. In 2025, Sinopec began operating the world’s largest green hydrogen plant in Xinjiang, with a capacity of 20,000 tons per year. Its domestic dominance gives it pricing power in a market where overcapacity is concentrated.
DuPont
Following its separation into three companies, the new DuPont focuses on electronics and industrial specialties. Its semiconductor materials unit posted 18% growth in 2025, driven by AI chip demand. DuPont is also a leader in next-generation photoresists for extreme ultraviolet (EUV) lithography, a critical enabler of Moore’s Law.
Global Market Leader
Multinational player commanding significant market share. Revenue exceeding $50B with operations across 100+ countries, diversified portfolio spanning all major price tiers.
Regional Champion
Dominant force in Asia Pacific with deeply localized product lines, extensive distribution networks, and strong regional retailer relationships.
Innovation Disruptor
Fast-growing challenger disrupting incumbents through breakthrough product innovation, direct-to-consumer models, and data-driven marketing in the energy & chemical materials space.
5. Market Trends
1. Biodegradable Plastics
BASF produces ecovio, a compostable bioplastic used in mulch films and food packaging. The EU’s Single-Use Plastics Directive is pushing demand: the global biodegradable plastics market is expected to reach $8.1 billion by 2028. BASF’s investment in a new PBAT plant in Germany adds 75,000 tons of annual capacity.
2. Green Hydrogen
Sinopec is a frontrunner, building the world’s largest green hydrogen facility in Xinjiang (20,000 t/yr) and operating hydrogen refueling stations across China. Green hydrogen is critical for decarbonizing ammonia production, a $70 billion market where Sinopec aims to become the low-carbon leader.
3. EV Battery Materials
Dow supplies lithium-ion battery electrolyte solvents and cathode binders. Its battery materials revenue grew 35% year-over-year in 2025. The shift to solid-state batteries could reshape demand, but Dow is investing in both liquid and solid-state platforms through internal R&D and partnerships.
4. Carbon Capture and Utilization
ExxonMobil Chemical is advancing its carbon capture and storage (CCS) portfolio, including a project at its Baytown, Texas complex that will capture 1 million metric tons of CO₂ annually. The company also partners with Global Thermostat to develop direct-air-capture technology for producing synthetic fuels.
6. Regional Markets
**Asia Pacific** – China accounts for 44% of global chemical production and is the epicenter of overcapacity. The government’s push for “dual carbon” targets is driving domestic investment in green hydrogen and bio-based chemicals, while Sinopec and Wanhua Chemical lead in polyurethane and specialty materials. India is emerging as a sourcing alternative, with Reliance Industries expanding its petrochemical complex in Gujarat.
Asia Pacific — The Growth Engine
The world's largest and fastest-growing region, led by China, India, and Southeast Asia. Urbanization, rising middle class, and digital retail adoption are primary catalysts.
North America — Premium & Wellness Driven
A mature market with strong health-and-wellness orientation, sustainability commitments, and robust demand for premium and functional products.
Europe — Quality & Regulatory Leadership
A developed market with stringent quality, safety, and environmental regulations. Strong demand for organic, locally sourced, and ethically certified products.
**North America** – The US benefits from low-cost ethane feedstock from shale gas. Dow operates three world-scale crackers on the Gulf Coast and is expanding its Texas City complex for polyethylene production. The Inflation Reduction Act provides tax credits for carbon capture and green hydrogen, spurring ExxonMobil Chemical’s CCS projects. Canada is positioning as a hub for low-carbon ammonia, with Nutrien and CF Industries converting existing plants.
**Europe** – BASF and other European players face high energy costs and tighter environmental regulations. The German government’s €50 billion support for industrial decarbonization includes funding for carbon-neutral steam crackers. European producers are pivoting to specialties: SABIC licenses its circular polymer technology to waste-plastic processors, helping meet the EU’s recycled-content mandates for packaging.
7. Investment Outlook
Two opportunities stand out for 2026 and beyond. First, intelligent R&D and SSbD chemicals – such as DuPont’s advanced photoresists or BASF’s biomass-balanced monomers – allow suppliers to capture premium pricing in electronics, pharmaceuticals, and sustainable consumer goods. Second, carbon removal and circularity are moving from pilot to profit: Dow’s partnership with LanzaTech shows that CO₂-derived chemicals can become cost-competitive with fossil-based routes within three years.
The key risk is persistent overcapacity in base chemicals, particularly polyethylene and polypropylene, which could depress margins through 2028. Buyers should stress-test supplier financials – the Deloitte outlook warns that companies with high debt and low specialty exposure are most vulnerable. VerityRank’s verification services help procurement teams assess supplier creditworthiness, environmental certifications, and operational resilience in real time.
Strategic Considerations:
- Technology & AI Integration: Artificial intelligence and IoT are revolutionizing production efficiency, quality assurance, and demand forecasting across the supply chain.
- Sustainability as Business Strategy: Regulatory pressure and consumer expectations are making environmental commitments essential, not optional.
- Transparency & Traceability: Consumers demand increasingly granular information about product origins, ingredients, and production methods.
- Emerging Market Penetration: Africa, Latin America, and second-tier Asian cities represent the next wave of volume growth.
Frequently Asked Questions
Data Sources
- Deloitte Insights, 2026 Chemical Industry Outlook
- American Chemistry Council, Mid-Year 2026 Outlook
- Grand View Research, Global Chemicals And Materials Market Report, 2026
- BASF Annual Report 2025
- SABIC Investor Relations
Make Informed Decisions in the Energy & Chemical Materials Market
Product quality and sourcing integrity directly impact business outcomes. Discover how Verity Rank's verification platform helps industry participants source with greater confidence.
Contact Verity Rank TodayFurther Reading: Explore additional market intelligence from Grand View Research and Mordor Intelligence.
This article is for informational purposes only, based on publicly available industry data and market reports as of 2026-07-30. All market figures are estimates and may vary from actual results.