At VerityRank, our ranking methodology is built on data, not opinions. We aggregate and cross-validate information from multiple authoritative third-party sources to produce the most objective industry ranking possible.
1. Data Sources — Multi-Source Cross-Verification
Our primary data comes from four pillars:
• Global Chemical Industry Databases: We incorporate ICIS Top 100 Chemical Companies rankings, C&EN's Global Top 50, Platts and Argus commodity price assessments, and national chemical industry association statistics from the American Chemistry Council (ACC), European Chemical Industry Council (CEFIC), and Japan Chemical Industry Association.
• Publicly Listed Company Financial Reports: For publicly traded companies, we analyze annual reports, quarterly filings, earnings call transcripts, and ESG disclosures from the Saudi Exchange (Tadawul), NYSE, LSE, Euronext, Shanghai Stock Exchange, Hong Kong Stock Exchange, and Frankfurt Stock Exchange, capturing verified revenue, profit margins, R&D spending, and sustainability commitments.
• AI-Driven Global Sentiment Analysis: We deploy natural language processing algorithms to analyze millions of downstream B2B buyer reviews, industry forum discussions, Google search trends, and professional procurement feedback across platforms in over 40 languages, capturing real-time market perception that traditional surveys miss.
• Industry Research Institutions and University Partnerships: We reference peer-reviewed studies and industry reports from the International Energy Agency (IEA), McKinsey Energy Insights, MIT Energy Initiative, and leading chemical engineering departments globally.
2. The Four-Dimensional Scoring Model
Each company is evaluated across four weighted dimensions:
• Brand Influence and Global Revenue (40%): Total global sales including China-market revenue, market share by major chemical product category, geographic footprint breadth, and year-over-year growth trajectory, verified against ICIS and national statistical agency data.
• Category Revenue Alignment (30%): Strict mapping against ten core energy and chemical subcategories—Automotive Energy, Fuels and Gaseous Energy, Daily Chemical Raw Materials, Plastics and Eco-Materials, Agrochemicals, Coatings and Dyeing Materials, Electronic Chemical Materials, Adhesives and Sealants, New Energy and Eco-Materials, and Household Chemical Products.
• Operational Infrastructure (20%): Quantitative assessment of global manufacturing facilities, countries with active business operations, total employee headcount, and demonstrated production capacity from millions of tons of refining throughput to electronic-grade chemical volumes.
• Brand Momentum Score (10%, scale 0–100): A composite dynamic indicator incorporating audited financial health (profitability, free cash flow), Google global search trend data, downstream B2B and B2C customer feedback, and latest M&A and supply chain developments.
3. Our Commitment to Independence
We do not accept payment for rankings. No company can pay to improve its position or to be included in our rankings. Our research team operates independently from our commercial operations. Rankings are updated quarterly to reflect the latest available data from corporate filings, industry databases, and market sentiment analysis.
Disclaimer: The data in this ranking is compiled from third-party authoritative sources, including ICIS global chemical industry rankings, national chemical industry associations, publicly listed company annual reports and financial filings, and independent ESG rating agencies. The ranking results are derived from a multi-dimensional algorithmic model and are intended for reference and market decision support only. They do not constitute direct investment advice or an absolute brand endorsement.
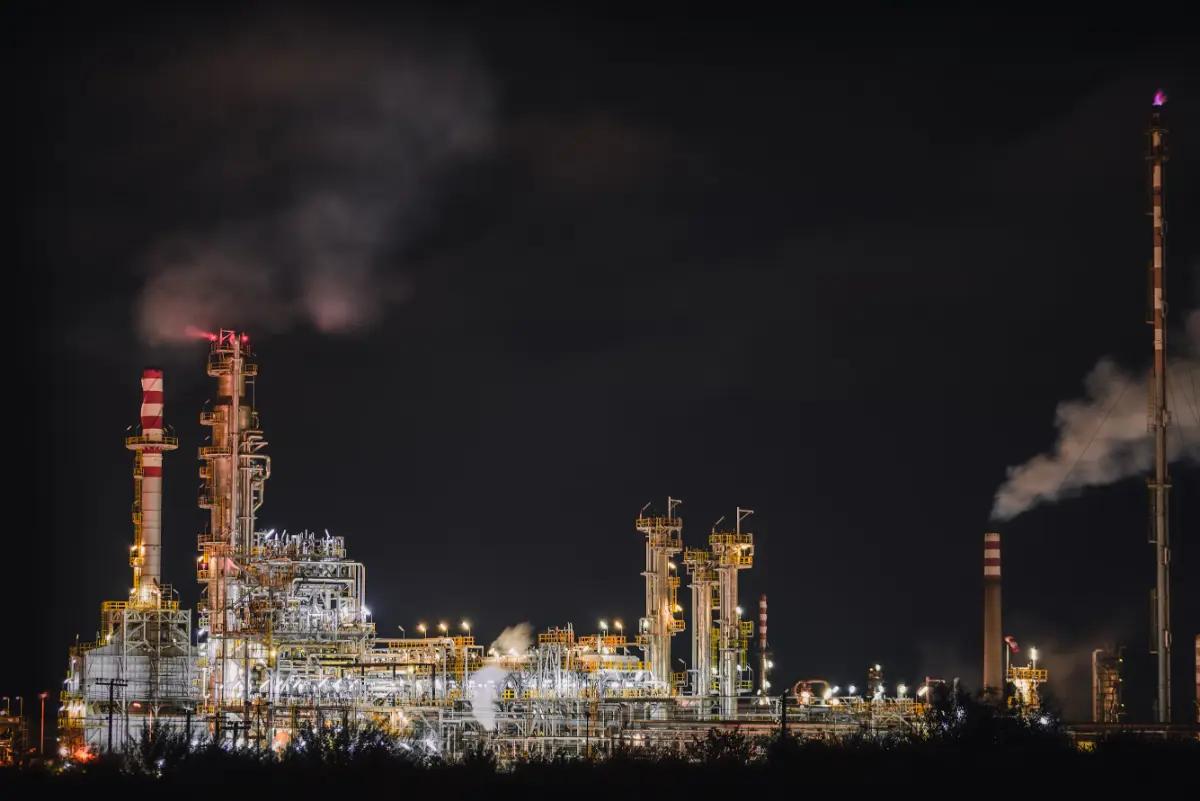
The energy and chemical industry is the industrial foundation of modern civilization, transforming raw natural resources—crude oil, natural gas, coal, minerals, and biomass—into the fuels, materials, and chemicals that power every other sector of the global economy. With an estimated combined market value exceeding $7 trillion in 2025, this sector is simultaneously the world's most capital-intensive, most regulated, and most strategically important industrial domain. The industry spans an extraordinarily broad spectrum of products and processes that collectively enable modern life.
Core Industry Segments
• Upstream Energy (Exploration and Production): Oil and gas exploration, drilling, extraction, and initial processing across conventional, deepwater offshore, shale/tight formations (hydraulic fracturing), and oil sands plays. Global crude oil production exceeds 100 million barrels per day, led by Saudi Aramco (approximately 10 million bpd), with the Permian Basin (US) and Guyana emerging as the two most significant growth regions.
• Midstream and Downstream Energy (Refining and Marketing): Crude oil refining into gasoline, diesel, jet fuel, heating oil, and petrochemical feedstocks. The world's largest refiners—Sinopec (300 million tonnes/year), ExxonMobil (4.5 million bpd), and Saudi Aramco (5.4 million bpd)—operate facilities that are among the most complex industrial installations on Earth.
• Petrochemicals and Base Chemicals: Converting hydrocarbon feedstocks (naphtha, ethane, LPG) into olefins (ethylene—the world's most produced organic chemical, approximately 200 million tonnes/year; propylene; butadiene) and aromatics (benzene, toluene, xylenes). These building blocks are the starting point for plastics, fibers, solvents, and synthetic rubber that touch nearly every manufactured product.
• Polymers and Performance Materials: Polyethylene (the world's largest-volume plastic, led by Dow and ExxonMobil), polypropylene, polyurethanes (MDI/TDI systems dominated by BASF and Wanhua Chemical), engineering plastics (polyamides, polycarbonates, PBT), and high-performance composites for automotive, aerospace, and construction applications.
Specialty Chemicals and Industrial Gases
• Specialty and Fine Chemicals: High-value, lower-volume chemicals for specific performance functions: catalysts (BASF is the global leader), coatings (PPG Industries dominates aerospace and automotive segments), electronic chemicals for semiconductor manufacturing, water treatment chemicals, agrochemicals (crop protection and fertilizers), and pharmaceutical intermediates.
• Industrial Gases: Atmospheric gases (oxygen for steelmaking, nitrogen for inerting, argon for welding) and process gases (hydrogen for refining and ammonia, carbon dioxide, helium). Linde operates the world's largest air separation network with over 1,000 production units, followed by Air Liquide.
Renewable Energy and Low-Carbon Technologies
• Solar photovoltaic manufacturing, wind turbine production, lithium-ion battery manufacturing, green hydrogen electrolysis, carbon capture and storage (CCS/CCUS), and sustainable aviation fuels (SAF)—rapidly growing segments that are reshaping capital allocation across the traditional energy-chemical complex.
Industry Dynamics in 2025
The energy and chemical industry is navigating its most profound transformation since the Haber-Bosch process revolutionized fertilizer production a century ago. Three structural shifts define the current landscape: the eastward migration of chemical production (Asia-Pacific now exceeds 45% of global chemical output, led by China), the fundamental reordering of feedstock economics (US Gulf Coast ethane advantage versus Middle Eastern NGLs versus Asian coal-based MTO), and the accelerating capital reallocation from fossil-derived to bio-based and circular chemical platforms driven by climate regulation, technology cost reduction, and downstream customer demand for low-carbon materials.
The energy and chemical industry operates at the frontiers of physics, chemistry, and process engineering, with competitive advantage determined by mastery of core process technologies, quality control systems, and the ability to anticipate and invest in emerging technology platforms. Understanding these technological and quality dimensions is essential for evaluating the relative positioning of the world's leading companies.
1. Refining and Petrochemical Process Technologies
• Fluid Catalytic Cracking (FCC): The primary gasoline production technology—Sinopec operates the largest FCC fleet globally, with modern units incorporating additives for propylene maximization, SOx reduction, and metals passivation. ExxonMobil's proprietary FCC technology is licensed to refiners worldwide.
• Steam Cracking: The dominant route to ethylene and propylene. Ethane-based cracking (predominantly on the US Gulf Coast—Dow, ExxonMobil, and Chevron Phillips Chemical operate the largest ethane cracker fleets) yields approximately 80% ethylene, while naphtha-based cracking (predominantly in Asia and Europe—Sinopec, BASF, and Shell) yields a broader product slate. Electrically heated steam crackers, pioneered in demonstration scale by BASF, SABIC, and Linde, represent the industry's primary decarbonization pathway for olefin production.
• Hydrocracking and Hydrotreating: High-pressure hydrogen addition to remove sulfur, nitrogen, and metals from heavy feedstocks. Sinopec's heavy and sour crude processing technology enables cost-effective utilization of discounted crude grades that lighter crude-dependent refiners cannot process economically.
• Methanol-to-Olefins (MTO) and Coal-to-Chemicals: Chinese-developed technologies that produce ethylene and propylene from coal-derived methanol, critically important for China's chemical self-sufficiency given its coal abundance and oil/gas import dependence, utilized by Sinopec and coal-rich provinces.
2. Sustainability and Decarbonization Technologies
• Carbon Capture, Utilization, and Storage (CCUS): Sinopec's 100-kilometer megaton-scale CO₂ transport pipeline—achieving 1,000+ days of safe operation in 2025—is one of the world's largest operational CCUS projects. ExxonMobil's Low Carbon Solutions division is investing billions in CCS hubs along the US Gulf Coast, while Shell and TotalEnergies are developing CCS projects in Europe and Australia.
• Chemical Recycling of Plastics: Pyrolysis (thermal decomposition producing oil for steam crackers), depolymerization (breaking polymers back to monomers), and dissolution technologies are being scaled by Dow (advanced recycling), BASF (ChemCycling project), and Shell (pyrolysis oil upgrading). These technologies address the fundamental limitations of mechanical recycling for contaminated or multi-layer plastic waste.
• Green Hydrogen: Produced via water electrolysis using renewable electricity. Shell operates Europe's largest PEM electrolyzer (10 MW at Rheinland), while Linde and Air Liquide are investing in large-scale electrolysis for refinery, ammonia, and mobility applications.
• Bio-Based Chemicals and Polymers: Wanhua Chemical launched 100% bio-based glycolipids and benzene-free carbomers at the 2026 in-cosmetics Global exhibition, demonstrating Asian leadership in bio-based specialty chemical platforms. BASF, Dow, and TotalEnergies are investing in bio-naphtha, bio-ethylene, and bio-based polymer platforms.
3. Quality Standards and Certification Frameworks
• ISO Management Systems: ISO 9001 (quality management), ISO 14001 (environmental management), ISO 45001 (occupational health and safety), and ISO 50001 (energy management) are baseline expectations for all top-tier chemical producers, with BASF and Dow maintaining certification across all global production sites.
• Responsible Care®: The chemical industry's global voluntary initiative for environmental, health, safety, and security performance—adopted by all top-10 companies in this ranking.
• Sustainability Ratings: MSCI ESG Ratings, Sustainalytics, CDP (Carbon Disclosure Project), and EcoVadis assessments are increasingly important for supplier qualification by downstream CPG and automotive customers, particularly in European markets.
• Product-Specific Standards: API (American Petroleum Institute) for oilfield equipment and lubricants, ASME for pressure vessels, ATEX/IECEx for explosive atmosphere equipment, and pharmacopoeia compliance (USP, EP, JP) for pharmaceutical-grade chemicals.
• ISCC PLUS and REDcert² Certification: Mass balance certification schemes that verify the sustainable sourcing and circularity of chemical feedstocks, increasingly demanded by brand owners seeking Scope 3 carbon reduction in their supply chains.
4. Digitalization and Industry 4.0 in Chemicals
The chemical industry is increasingly adopting AI-driven process control, digital twins for plant optimization, predictive maintenance, and supply chain digitization. Companies like BASF and Dow have deployed digital twins of their cracker and polymer operations, while Sinopec and ExxonMobil utilize AI for refinery-wide optimization that can improve margin capture by 2-5%—representing hundreds of millions of dollars annually at their operational scale. Process safety is being enhanced through AI-assisted anomaly detection and predictive analytics that identify potential equipment failures before they result in safety incidents or unplanned outages.
Sourcing energy and chemical products—whether as a manufacturer procuring feedstock chemicals, a fuel distributor, a construction company purchasing petrochemical derivatives, or a government agency managing strategic reserves—requires navigating extreme price volatility, stringent safety and environmental regulations, and complex global supply chains. The decisions buyers make in supplier selection can determine their competitive cost position, supply reliability, and ESG compliance profile for years.
1. Price Risk Management and Feedstock Strategy
Energy and chemical commodity prices are among the most volatile in any market. Key considerations:
• Understand Pricing Benchmarks and Regional Differentials: Crude oil (Brent, WTI, Dubai/Oman), natural gas (Henry Hub at $2-4/MMBtu vs. TTF at $10-15/MMBtu, creating a 3-5× European cost disadvantage), ethylene and propylene (monthly contract prices vs. spot), and aromatics (ICIS, Platts, Argus assessments). The $3-5/MMBtu structural US ethane advantage over naphtha has driven $200 billion in US Gulf Coast chemical investment since 2015.
• Pricing Mechanism Selection: Fixed price provides budget certainty; formula-based pricing (linked to published indices ± premium/discount) shares market risk; cost-plus arrangements shift margin risk to the supplier. For long-term contracts, regional feedstock cost exposure should be modeled—a European naphtha-based contract carries fundamentally different economics than a US ethane-based contract.
• Hedging Instruments: Futures and options on crude oil (CME/NYMEX, ICE), natural gas (Henry Hub, TTF), and select petrochemicals (Dalian Commodity Exchange for Chinese chemical futures) can manage price exposure. For less liquid products—specialty monomers, electronic-grade chemicals—consider price floors/caps or index-linked pricing with lag mechanisms.
• Force Majeure and Supply Disruption Planning: The energy-chemical industry experiences frequent supply disruptions: hurricanes (US Gulf Coast—each major hurricane can disrupt 20-30% of US ethylene capacity for weeks), freeze events (Texas 2021 Uri), geopolitical events, and unplanned plant outages. Contracts must include clear force majeure provisions, and buyers should qualify secondary suppliers in different geographic regions where feasible.
2. Supplier Technical Capability and Quality Evaluation
• Production Technology Assessment: Understand the supplier's feedstock and process route. An ethane-based polyethylene producer (Dow, ExxonMobil—US Gulf Coast) has fundamentally different cost structures than a naphtha-based producer (BASF, Sinopec—Europe/Asia). A coal-based methanol-to-olefins producer (China) operates with economics entirely decoupled from global oil and gas prices.
• Plant Reliability and Maintenance Schedules: Request historical on-stream factors (% of nameplate capacity) and scheduled maintenance turnaround calendars. Unplanned cracker outages—common in the industry—can disrupt downstream derivative supply for weeks. Companies with multiple crackers (Dow: 12+; Sinopec: 20+) offer greater supply redundancy.
• Quality Consistency and Certificates of Analysis: For chemical feedstocks, even minor impurity variations can affect downstream polymerization or formulation processes. Review COA data across multiple batches for specification adherence. Polymer buyers should evaluate Melt Flow Index (MFI) stability, additive package consistency, and color/haze specifications. Electronic chemical buyers require sub-ppb purity certification.
• Logistics Infrastructure Resilience: Assess the supplier's storage terminals, pipeline connections, rail access, port facilities, and truck fleets. Suppliers with multi-modal logistics options—pipeline, marine, rail, and truck—like Shell, ExxonMobil, and Sinopec provide greater resilience to single-mode disruptions.
3. Safety, Regulatory, and ESG Compliance
• Process Safety Record: Review OSHA Total Recordable Incident Rate (TRIR), Lost Time Incident Rate (LTIR), and Process Safety Event (PSE) rates. Companies like ExxonMobil and Linde publish detailed safety performance data. A supplier with a weak safety culture poses business continuity risk—a single major process safety incident can disrupt supply for months.
• Chemical Regulatory Compliance Across Jurisdictions: Ensure products meet REACH (EU), TSCA (US), K-REACH (South Korea), and local chemical inventories in target markets. Verify PFAS restrictions compliance, endocrine disruptor regulations, and emerging microplastics legislation that increasingly affects polymer suppliers.
• Product Carbon Footprint and Sustainability Credentials: Request Product Carbon Footprint (PCF) data, Life Cycle Assessments (LCA), and Environmental Product Declarations (EPDs). The carbon intensity of ethylene—ranging from approximately 1.0 tCO₂/t ethylene (ethane-based, US Gulf Coast) to 1.8-2.0 tCO₂/t (naphtha-based, Europe/Asia)—is increasingly material for downstream customer Scope 3 accounting.
4. Commercial and Contractual Best Practices
• Volume Commitments and Take-or-Pay Structures: The chemical industry values long-term, stable offtake. Multi-year contracts typically secure better pricing and guaranteed allocation during tight markets. For on-site industrial gas supply (Linde, Air Liquide), 15-20 year take-or-pay contracts are the industry standard.
• Incoterms and Delivery Responsibility: For bulk liquid chemicals (ethylene, propylene, benzene), pipeline or marine delivery terms differ fundamentally from containerized solid products (polyethylene pellets, polymer powders). Clarify responsibility for transportation, insurance, and customs clearance.
• Technical Support and Application Development: The leading chemical suppliers—BASF, Dow, ExxonMobil—provide substantial application development support, formulation assistance, and regulatory guidance that creates value beyond the molecule. This technical partnership capability is a distinguishing factor when comparing otherwise similar chemical grades.
The energy and chemical industry, accounting for approximately 5% of global CO₂ emissions from chemical production alone plus the embedded emissions of the fuels it produces, faces the most complex sustainability challenge of any industrial sector. Evaluating ESG leadership requires examining not only operational emissions and safety performance but also the fundamental strategic question of how companies are repositioning their asset portfolios and technology platforms for a net-zero economy. The following analysis highlights the companies in the VerityRank Energy and Chemical Top 10 that are most advanced in ESG performance.
1. Carbon Capture, Utilization, and Storage (CCUS) Deployment
Sinopec has emerged as an unexpected global leader in operational CCUS, with its 100-kilometer megaton-scale CO₂ transport pipeline achieving over 1,000 days of safe uninterrupted operation by 2025—one of the world's largest operational CCUS infrastructure projects. This pipeline connects CO₂ capture at Sinopec's Qilu refinery-petrochemical complex to enhanced oil recovery and permanent geological storage, demonstrating commercial-scale CCUS operation at a level unmatched by Western peers. ExxonMobil is deploying multi-billion-dollar investments through its Low Carbon Solutions division to develop CCS hubs on the US Gulf Coast, leveraging its subsurface expertise and existing pipeline infrastructure, though these projects remain at earlier stages of development compared to Sinopec's operating asset. Shell and TotalEnergies are developing CCS projects in Europe (North Sea storage) and Australia, though regulatory and commercial frameworks for CCS remain less mature than in the US and China.
2. Renewable Energy Integration and Electrification
TotalEnergies leads all integrated energy companies in this ranking with 35 GW of installed renewable electricity capacity—predominantly solar photovoltaic and onshore/offshore wind—and a pledged target of 100 GW by 2030. This capital commitment, representing tens of billions of dollars, is the most aggressive among any supermajor and positions TotalEnergies to generate a growing share of earnings from renewable electricity by the end of this decade. Shell has built a global EV charging network (Shell Recharge, 50,000+ charge points), wind assets (offshore Netherlands, US), and solar generation, though its renewable capex as a percentage of total capex remains below TotalEnergies' commitment level.
3. Bio-Based and Circular Chemical Platforms
Wanhua Chemical (ranked in the ICIS Top 100 but outside this specific VerityRank Top 10) launched 100% bio-based glycolipids and benzene-free carbomers at the 2026 in-cosmetics Global exhibition, showcasing Asian leadership in bio-based specialty chemicals. BASF maintains industry-leading R&D investment in bio-based intermediates, biodegradable polymers (ecovio), and the ChemCycling project for chemical recycling of mixed plastic waste. Dow has committed to commercializing 3 million metric tons of circular and renewable solutions annually by 2030 and is investing in advanced recycling (pyrolysis-based) to produce circular polyethylene indistinguishable from virgin resin. Saudi Aramco, while traditionally viewed through a hydrocarbon lens, has begun investing in blue hydrogen production (SMR with CCS) and non-metallic materials research aimed at reducing carbon-intensive steel consumption in construction.
4. Product Portfolio Transformation Toward Low-Carbon Markets
BASF's 2025 divestiture of automotive coatings to Carlyle (€7.7 billion) represents one of the most significant portfolio reshaping transactions in chemical industry history, releasing capital from a mature, capital-intensive segment to redeploy into higher-growth, sustainability-aligned platforms including battery materials (high-nickel cathode active materials) and bio-based intermediates. Linde is uniquely positioned in the clean hydrogen value chain, with leadership in hydrogen production, liquefaction, storage, and refueling infrastructure—a technology portfolio that directly serves the decarbonization of refining, ammonia production, steelmaking, and heavy-duty transport. PetroChina and Sinopec are investing in new materials research institutes focused on carbon fiber composites, battery materials precursors, and high-performance engineering polymers that enable lightweight vehicle manufacturing and renewable energy infrastructure.
5. Safety, Governance, and Disclosure Performance
ExxonMobil and Linde publish the most comprehensive safety performance data among companies in this ranking, with detailed Process Safety Event (PSE) rates and Total Recordable Incident Rate (TRIR) metrics disclosed in annual sustainability reports. Shell provides detailed Scope 1, 2, and 3 emissions reporting aligned with TCFD and ISSB frameworks, though its climate litigation exposure (the 2025 Milieudefensie lawsuit) creates ongoing governance risk. Saudi Aramco published its 2024 Sustainability Report with expanded disclosure on its methane intensity reduction program, though its status as a majority state-owned enterprise limits the governance transparency achievable by publicly listed Western peers. State Grid, as a non-listed state-owned enterprise, faces inherent limitations on financial and governance disclosure transparency compared to publicly listed companies, though its operational role as the central enabler of China's renewable energy integration indirectly generates one of the world's largest avoided-emissions impacts.
Conclusion: ESG and sustainability leadership in the energy and chemical industry is not a binary state but a trajectory. TotalEnergies leads in renewable energy capital commitment, Sinopec leads in operational CCUS deployment, BASF leads in portfolio transformation toward sustainability-aligned growth platforms, and Dow leads in circular economy material solutions. The critical evaluation factor is whether each company's sustainability investments represent a credible pathway to a competitive business model in a net-zero economy, or primarily a risk management exercise designed to maintain the social license to operate for legacy hydrocarbon assets.