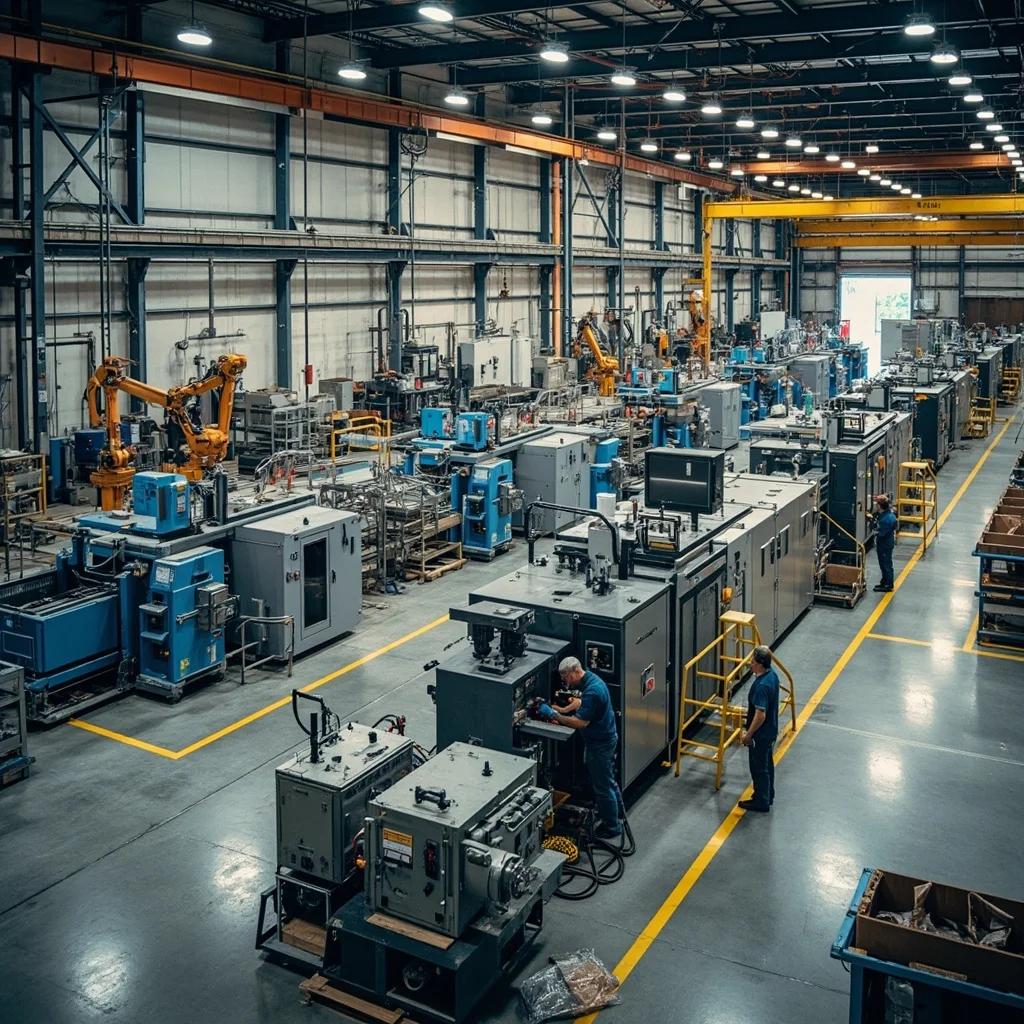
VerityRank applies a dedicated four-dimensional manufacturing evaluation framework tailored specifically for the B2B metal packaging supplier assessment context. Unlike consumer brand rankings, our manufacturer evaluation places equal weight on production capabilities and operational execution rather than market-facing brand metrics. The Production Scale dimension (25%) quantifies each manufacturer's annual output capacity in billion-unit equivalents — Ball Corporation leads the industry with approximately 110 billion cans produced across 65+ facilities, while Crown Holdings maintains 179 plants producing over 100 billion units annually. We assess each facility's installed DWI (drawn and wall ironed) line count and rated speed — modern lines operate at 2,000-3,000 cans per minute, and the total installed line count directly correlates with fixed-cost absorption advantage.
The Manufacturing Technology dimension (25%) evaluates proprietary manufacturing process innovations that create competitive moats. Key indicators include lightweighting technology patents (reducing aluminum usage per can by 0.5-2% annually), high-definition digital printing and matte finishing capabilities, and end-to-end automation maturity — from coil handling through palletizing. Supply Chain Reach (25%) maps each manufacturer's geographic plant distribution against global beverage filling capacity, aluminum sheet procurement agreements with suppliers like Novelis and Constellium, and regional logistics infrastructure. Finally, Sustainability & Compliance (25%) tracks verified post-consumer recycled content — Ball's industry-leading 70%+ average recycled content for aluminum cans in North America sets a benchmark — alongside science-based emissions reduction targets validated by the SBTi and ISO 14001/FSSC 22000 certifications across manufacturing networks.
Data is refreshed quarterly using publicly available sources including SEC filings for U.S.-listed manufacturers (Ball, Crown, Sonoco, Silgan), Tokyo Stock Exchange disclosures for Toyo Seikan, and annual sustainability reports for privately held producers (Ardagh, CANPACK, Trivium, Envases).
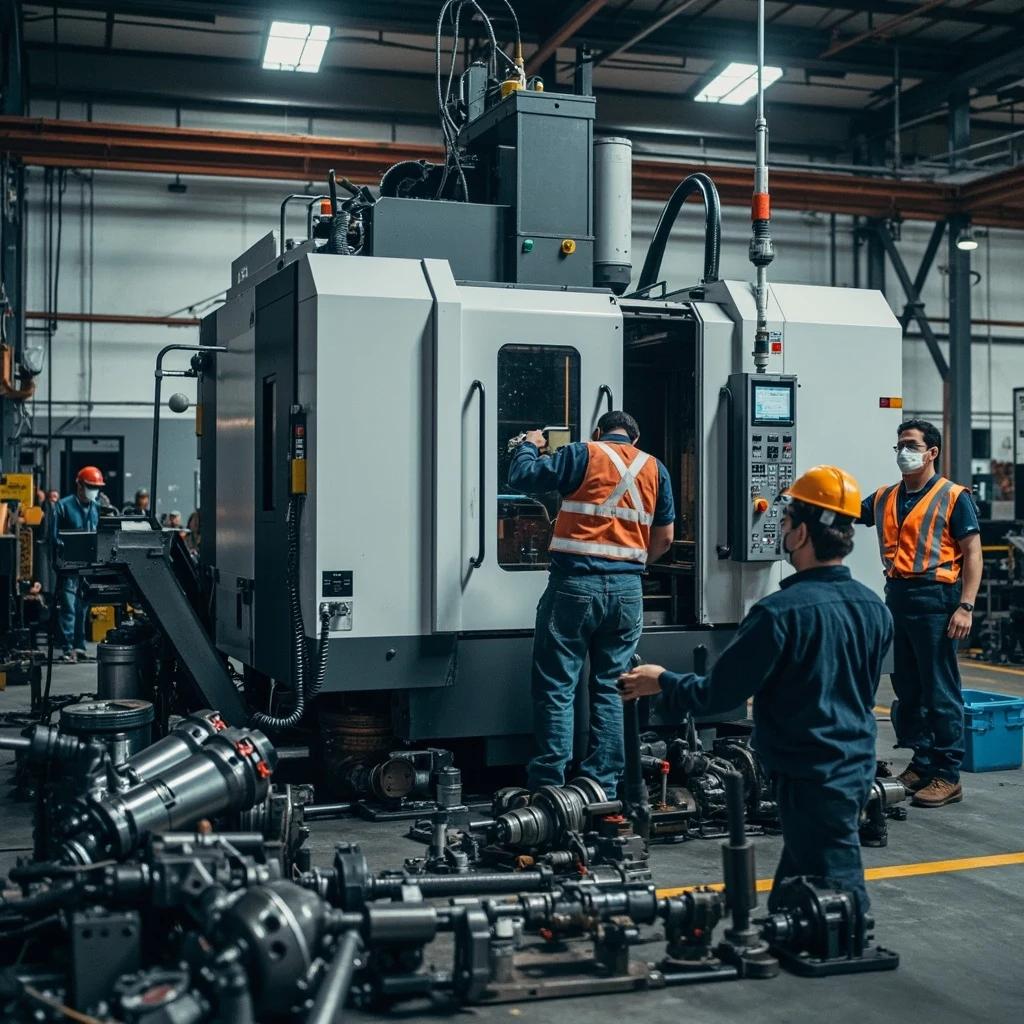
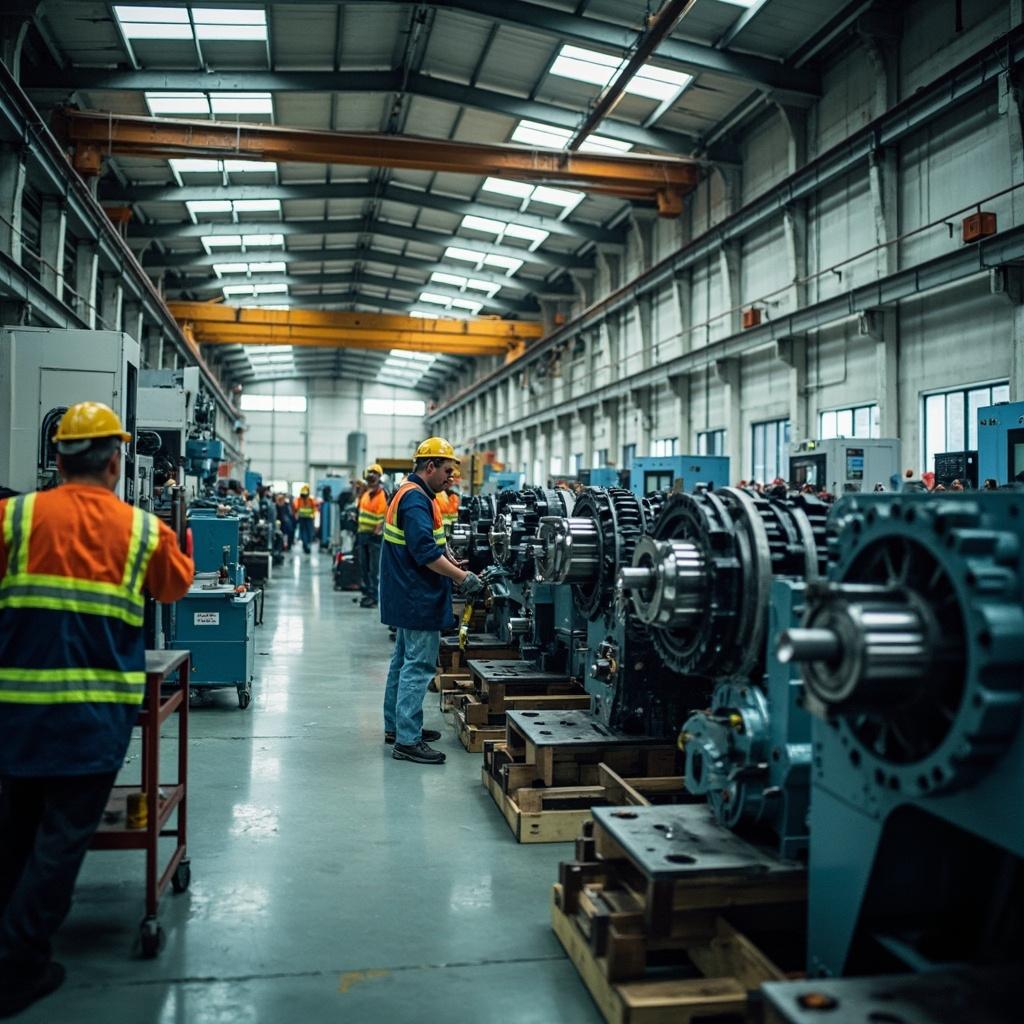
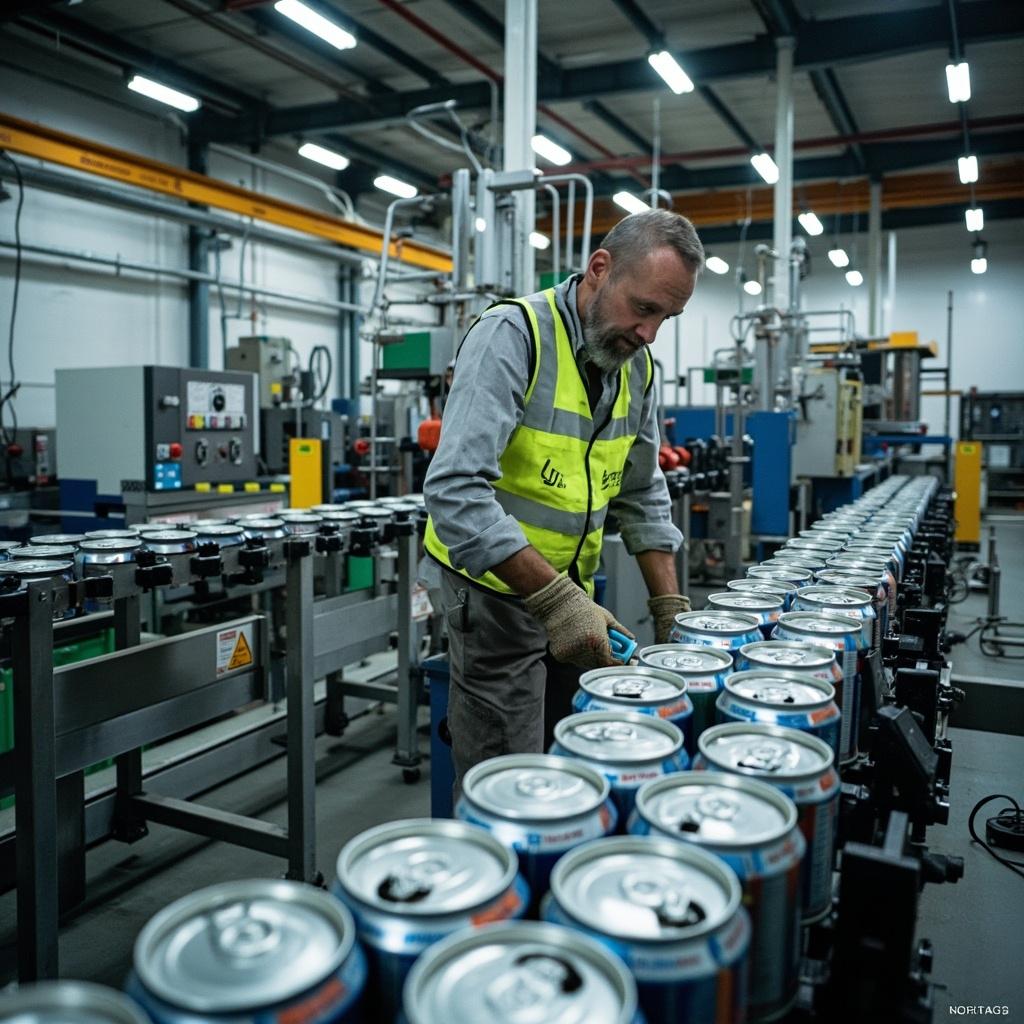
World-class metal packaging manufacturing is defined by mastery of the DWI (Drawn and Wall Ironed) two-piece can production process, which represents the technological core of modern beverage can manufacturing. The DWI process transforms aluminum coil stock into finished cans through a continuous sequence of cupping, drawing, wall ironing, trimming, washing, decorating, necking, and flanging — all operating at speeds exceeding 2,000 cans per minute on a single line. A world-class manufacturer operates multiple DWI lines across a geographically diversified plant network, with each line representing a $100-150 million capital investment that requires specialized engineering expertise to install, maintain, and optimize. The body maker — the central machine that draws and irons the aluminum cup into a can body — is the most technically demanding component, and manufacturers differentiate themselves through proprietary body maker technologies, precision tooling capabilities, and process control algorithms that maximize throughput while minimizing material waste.
Beyond DWI, world-class manufacturers demonstrate excellence in complementary manufacturing competencies that create full-service value for customers. Two-piece steel food can manufacturing (draw-redraw and draw-wall ironing processes) serves the food and pet food segments with different material and process requirements. Three-piece welded can production remains essential for industrial containers, aerosol packaging, and specialty formats. High-speed end (lid) manufacturing is a specialized sub-discipline requiring precision stamping at 3,000-5,000 ends per minute. Advanced decoration capabilities — including 8+ color high-definition digital printing, matte and tactile finishes, thermochromic inks, and registered embossing — are increasingly important as brands use the can itself as a marketing canvas. Leading manufacturers also maintain in-house tooling shops for can tooling fabrication and repair, chemical coatings laboratories for internal liner development, and quality assurance laboratories equipped with automated vision inspection systems, burst pressure testers, and spectrophotometers.
The manufacturing excellence benchmark also extends to operational metrics including overall equipment effectiveness (OEE), scrap rates (world-class operations target below 1.5% aluminum scrap), changeover time between can sizes, and the ability to run lightweight can designs that reduce material costs while maintaining structural integrity.
The global metal packaging manufacturing supply chain is undergoing its most significant restructuring since the industry's post-WWII expansion, driven by tariff volatility, geopolitical realignment, and the secular growth of aluminum beverage cans across emerging markets. The traditional model — where large-volume can production was concentrated in low-cost regions and shipped globally — is being replaced by a "local-for-local" manufacturing paradigm. This shift is most visible in Southeast Asia, where manufacturers including Ball, Crown, and CANPACK have collectively announced over $2 billion in new can plant investments since 2022, targeting Vietnam, Thailand, Indonesia, and the Philippines as anchor production hubs serving ASEAN beverage markets. Similarly, in South America, manufacturers are expanding capacity in Brazil and building greenfield plants in Colombia and Peru to serve growing beer and soft drink markets without relying on trans-Atlantic can shipments that incur 8-12% logistics cost penalties.
Raw material supply chain dynamics are equally transformative, with aluminum coil procurement representing 60-70% of a can's total manufactured cost. The relationship between can manufacturers and aluminum rolling mills — dominated by Novelis (Aditya Birla Group), Constellium, and UACJ — is increasingly structured through long-term supply agreements with pass-through pricing mechanisms tied to LME aluminum plus regional conversion premiums. Manufacturers with the strongest balance sheets (Ball, Crown, Sonoco) can negotiate multi-year coil supply contracts with volume flexibility clauses, while smaller producers face spot market exposure. The growing adoption of aluminum scrap closed-loop recycling — where can manufacturers collect post-consumer used beverage cans (UBCs) and feed them back into rolling mill supply chains — is creating a secondary material procurement advantage for manufacturers with established UBC collection networks, reducing both raw material costs and carbon footprint.
The logistics dimension is also evolving, with manufacturers increasingly co-locating can plants adjacent to major beverage filling operations. This "through-the-wall" model, where cans are conveyed directly from the can plant into the filling line via overhead bridge systems, eliminates secondary packaging, transport, and warehousing costs entirely — a competitive advantage that is reshaping plant siting decisions across the industry.
Selecting the right metal packaging manufacturing partner requires a structured evaluation that extends far beyond unit price comparison — the total cost of ownership (TCO) includes freight, inventory carrying costs, quality failure risk, and supply continuity assurance. Begin by assessing the manufacturer's geographic proximity to your filling operations: a can plant located within 300 kilometers of your beverage filling facility typically reduces freight costs by 5-8% compared to transcontinental sourcing and enables just-in-time (JIT) delivery that minimizes on-site can inventory requirements. The "through-the-wall" co-location model — where can production is physically integrated with filling — represents the optimal configuration for high-volume beverage operations exceeding 500 million units annually, with pioneers including Ball's co-located facilities serving major breweries and soft drink bottlers.
Manufacturing quality consistency is the single most critical procurement criterion — a single defective can that fails during pasteurization or causes a leaker on retail shelves can trigger product recalls costing millions. Evaluate the manufacturer's quality management system maturity: ISO 9001 certification is baseline; FSSC 22000 or BRCGS packaging certification demonstrates food safety system rigor; and statistical process control (SPC) documentation showing can dimensional capability indices (Cpk > 1.33 for critical specifications including flange width, bead depth, and dome reversal pressure) provides quantitative quality assurance. Request a plant audit focusing on vision inspection system technology generation, in-line leak detection methods, enamel coverage testing protocols, and microbiological control programs for water systems used in can washing.
Commercial terms evaluation should address supply agreement structure, innovation pipeline, and long-term partnership alignment. Long-term supply agreements (3-7 years) are industry standard and should include volume flexibility bands (typically ±15-20%), aluminum price pass-through mechanisms referenced to PRA/Metal Bulletin indices, and minimum performance guarantees covering OEE, on-time delivery, and quality KPIs. Assess the manufacturer's innovation roadmap — are they investing in next-generation lightweight can designs that reduce material costs? Do they offer advanced decoration capabilities (digital printing, tactile finishes) that support brand differentiation? Are they developing emerging formats like resealable aluminum bottles? The most valuable manufacturing partnerships extend beyond transactional supply to collaborative product development.
Environmental sustainability has become a central strategic pillar for metal packaging manufacturers, driven by aluminum's infinite recyclability advantage, tightening regulatory frameworks including the EU Packaging and Packaging Waste Regulation (PPWR), and beverage brand customers' Scope 3 emissions reduction commitments. The recycled content metric is the industry's most visible sustainability indicator: Ball Corporation achieves an industry-leading average of 70%+ recycled content in its North American aluminum cans, meaning the typical Ball-produced beverage can contains more than two-thirds post-consumer material. Crown Holdings targets 60% average recycled content globally, while virtually all major manufacturers have committed to increasing recycled content ratios as UBC (used beverage can) collection infrastructure improves. This directly reduces the carbon footprint of can production — using recycled aluminum requires only 5% of the energy compared to primary aluminum smelting, reducing the embedded carbon of a beverage can by up to 90% when produced from recycled content.
Beyond recycled content, leading manufacturers are targeting comprehensive decarbonization across their manufacturing operations through renewable energy procurement, furnace electrification, and process efficiency improvements. Ball Corporation has validated science-based targets aligned with a 1.5°C pathway through the Science Based Targets initiative (SBTi), with commitments to reduce absolute Scope 1 and 2 emissions by 55% by 2030 (from a 2017 baseline). Crown Holdings targets a 50% reduction in Scope 1 and 2 emissions intensity by 2030. These commitments translate to concrete operational changes: solar and wind power purchase agreements (PPAs) covering manufacturing facilities in Europe and North America, transition from natural gas-fired thermal oxidizers to electric regenerative thermal oxidizers in can coating operations, and optimized aluminum coil annealing processes that reduce natural gas consumption.
Water stewardship and circular economy innovation represent the next frontier of packaging manufacturing sustainability. Can washing operations are water-intensive, consuming 0.5-1.5 liters of water per can produced, and leading manufacturers are deploying closed-loop water recycling systems, reverse osmosis treatment, and rainwater harvesting to reduce freshwater withdrawal. On circular economy, manufacturers are pioneering closed-loop aluminum recycling partnerships that collect UBCs from municipal recycling streams and deposit return systems, feed them back into rolling mill supply chains, and create a continuous material loop that dramatically reduces reliance on primary aluminum. Ardagh's partnership with Novelis on closed-loop can-to-can recycling and Ball's "Recycle Challenge" programs represent the industry's most ambitious circular economy initiatives.